Ripon Grammar School Admissions
A beautiful kind of cross-over post today - half of the time I write about data science, and half of the time I write something about parenting. Today, I’m writing about using my data skills to help my parenting. Huzzah!
Ripon Grammar School
One of the best local schools is Ripon Grammar, but we’re not actually in catchment for it. However, we’re pretty close and using FOI requests and regularly published data, I can start to build up a picture of how far out the ‘acceptance’ boundary stretches.
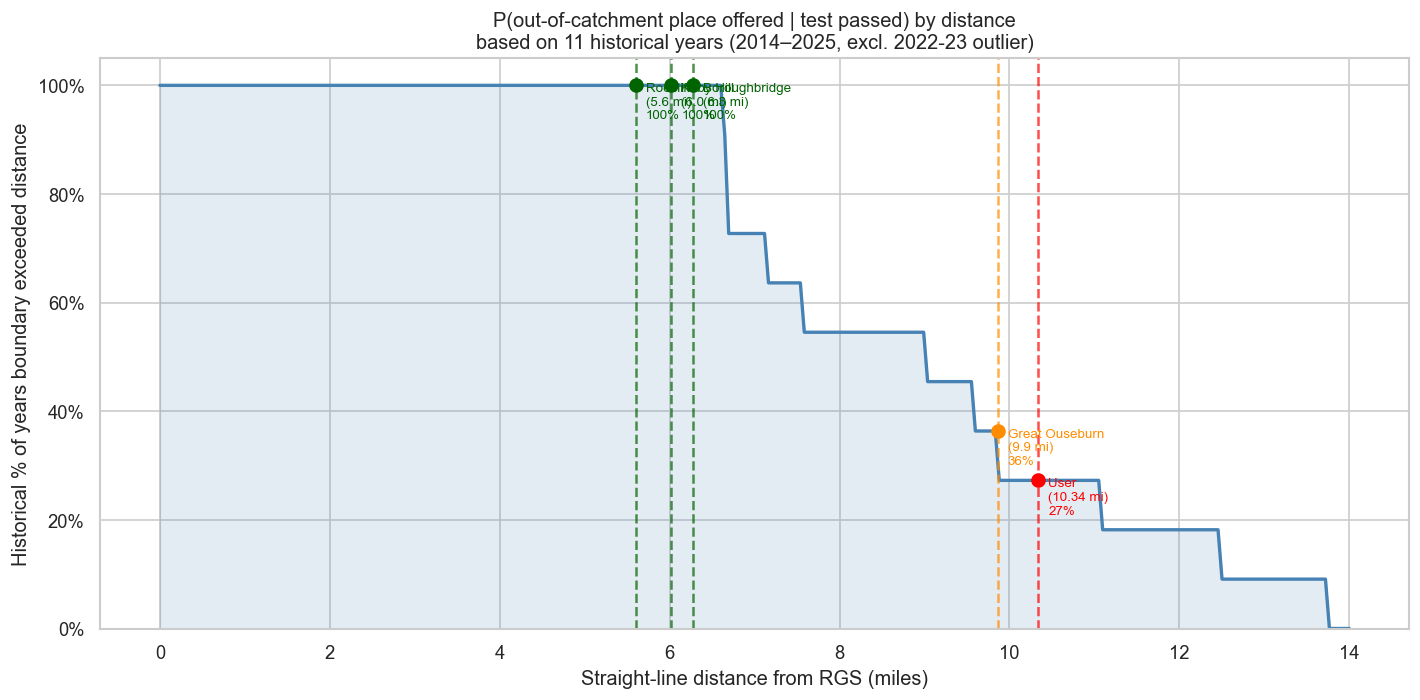
Of course, this is helpful and gives a rough idea of where the boundary typically is. Except, wouldn’t it be great if we could include population-level data and see whether or not that has an impact?
Adding population data
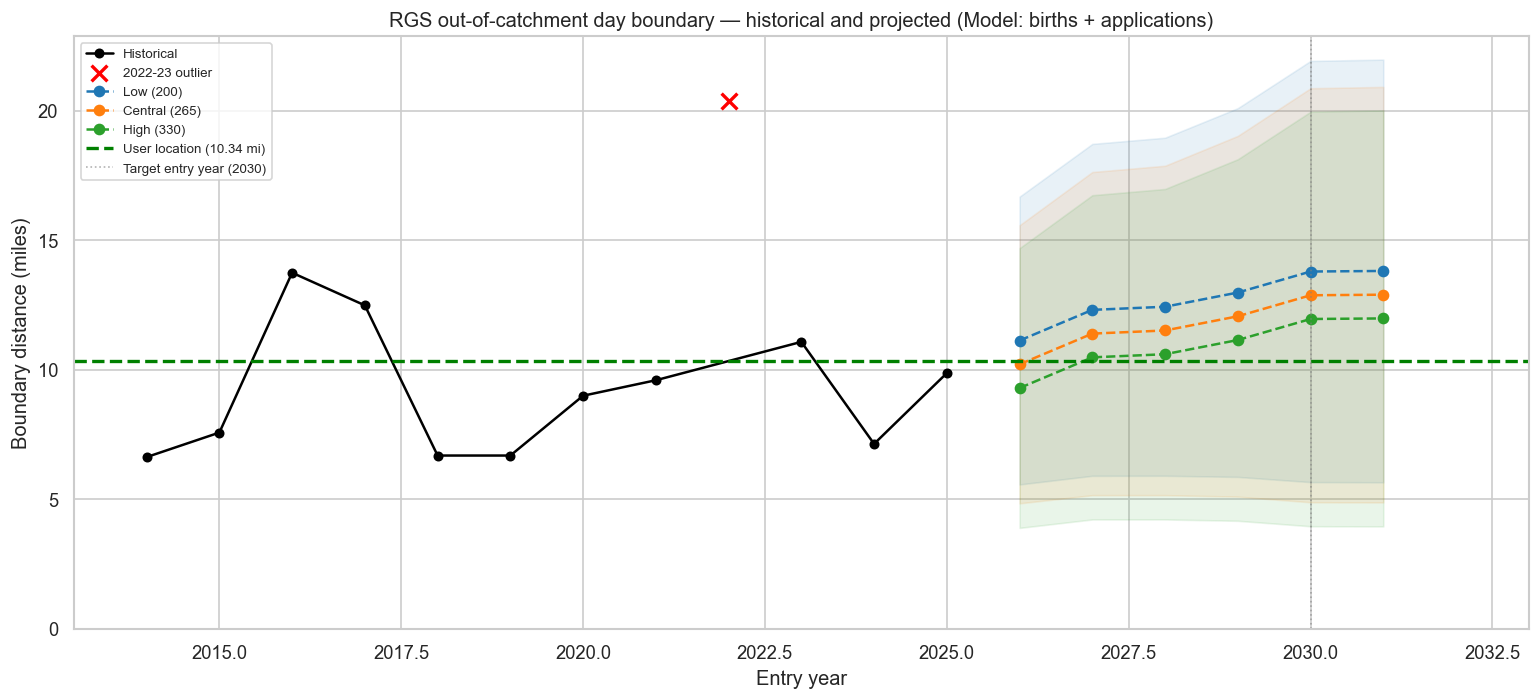
It follows that changes in the number of children in a given school year is going to impact how competitive school admissions are. If the number of places stays the same but the number of children falls, we’d expect to see a wider radius.
If we build a model using both the number of births in the Harrogate district, and the location of the furthest accepted out-of-catchment student, we get the following set of predictions…
Should we Believe this?
For my non-data-familiar friends…maybe we should believe this but we should probably maintain a healthy degree of scepticism. Historically, the acceptance threshold has jumped around quite a lot, and whether the number of children born in Harrogate district is a key driver of RGS admission statistics isn’t established in anything I’ve shared. I’ve done that analysis separately, and it is a slight contributing factor, but no more than that.
I have some outstanding FOI requests that’ll hopefully give me a more accurate answer, but given the extremely small data set and the high variability…I’m only going to do ever-so-slightly better than guessing.
I may have done some fancy stuff and I’ll do better than somebody who is just guessing, but it’s important to understand limitations and we’re not short of them here.
Importance of Data Analysis
This is a really high stakes bit of analysis for me personally. If our children pass the 11+ and get into Ripon Grammar School, that’ll be wonderful. Otherwise, potential options are substantially worse secondary schools (based on OFSTED/test results/vibe), expensive private schools, or moving house.
All of those options come with fairly major downsides, and so if my analysis could confidently say that we’re fine where we’re living now and don’t need to consider anything other than testing into RGS…all the better. However, that isn’t what I’m finding and I don’t know that I’ll believe any degree of data wrangling that says we can be confident in acceptance.
Interpreting probabilities is hard, and it’s especially hard when the stakes are high.
Tooling and the LLM Revolution
I’d be remiss if I didn’t state that I’d carried out this analysis using Claude Code. I’d previously carried out the first stage of analysis “manually” (like a caveman…just by writing code) but figured I’d give Claude access to my repo and let it run wild. It very quickly and easily added the population data and modelled it out, creating the graphs in the process.
You can see the code here.
Nice job Claude. Nice job.
Conclusion
If you live about 5 miles from RGS, you’ll probably be fine even if you’re not in the catchment area. If you live about 13 miles from RGS, you probably won’t be. I live around 10 miles and things aren’t looking good. However, I’ll update this analysis every year for the next few years and see how things shape up.
It’s nice to be able to use my professional skills to help my family in a more direct way than simply working for a salary. I’d love to find more ways to use data to support them. I’ll keep an eye out for future projects like this.