England's Hidden Housing Subsidy
With all the fuss on (my) Twitter about social housing in London, I thought it’d be worth trying to understand things using public data. It turns out, England’s social housing system delivers a £21 billion annual subsidy that I’ve never seen on a manifesto or in a spending review, and is overwhelmingly concentrated in the wealthiest part of the country. Here, we’re going to quantify that subsidy for every local authority in England.
TL;DR: to London.
The mechanism
I’m going to argue that social housing (and social rents) allow people to live in a location at below market rate. The gap between what a tenant would pay on the open market and what they actually do pay is a Governmentally funded economic transfer - it’s basically the same as housing benefit payment but through exclusive use of a public asset, rather than direct expenditure. Because of this, it doesn’t appear in any budget. But it’s a real cost all the same (suppression of returns on publicly held assets).
Add that gap up across all 3.2 million social homes in England and the total is roughly £21 billion per year.
Where it goes
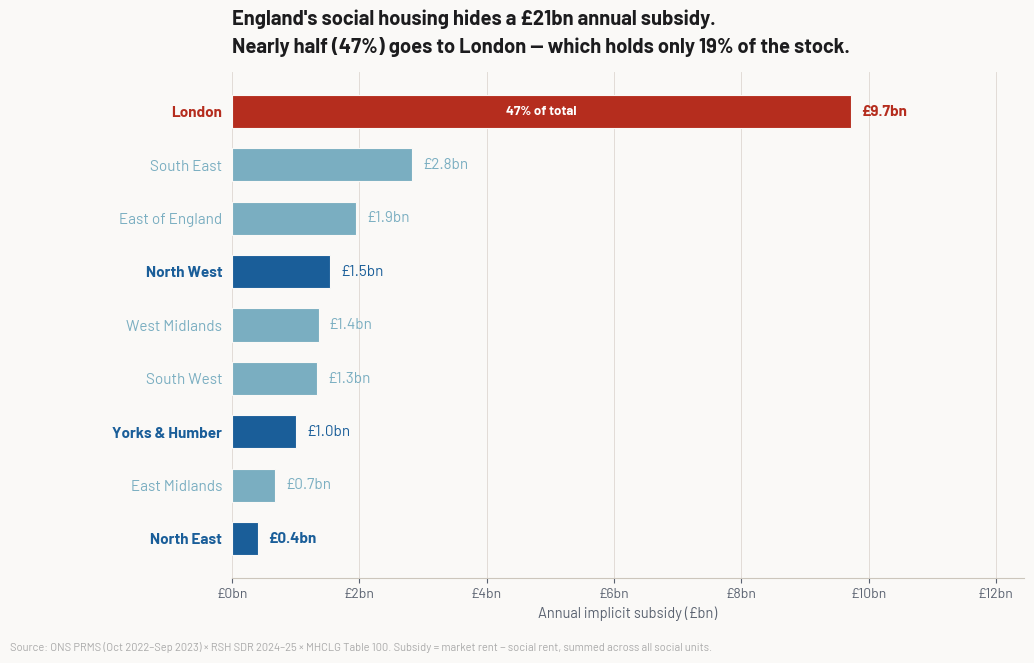
London receives 47% of the total implicit subsidy while holding only 19% of the social housing stock. London and the South East together absorb 60% — more than the combined share of every Northern and Midlands region.
The comparison that hits hardest:
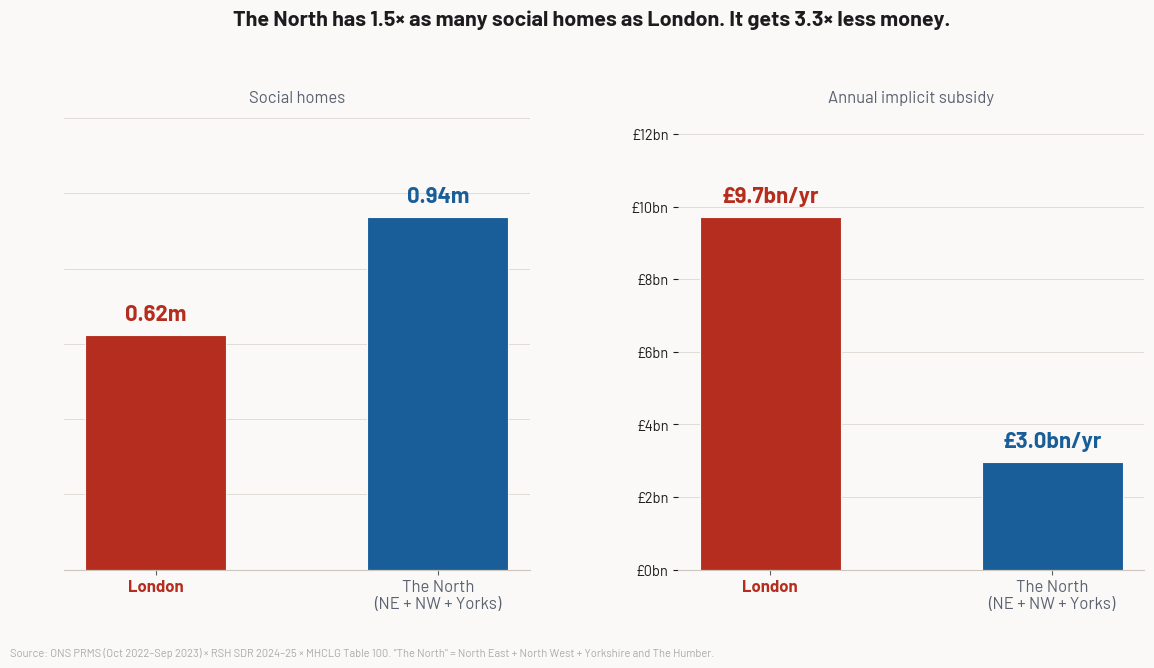
The North East, North West, and Yorkshire combined have 940,000 social homes to London’s 620,000. They receive £3 billion per year in implicit subsidy. London receives £9.7 billion. More homes. 3.3 times less money.
The 44:1 lottery
Every local authority in England operates under the same national policy and the same formula. The subsidy each tenant receives depends entirely on where they live.
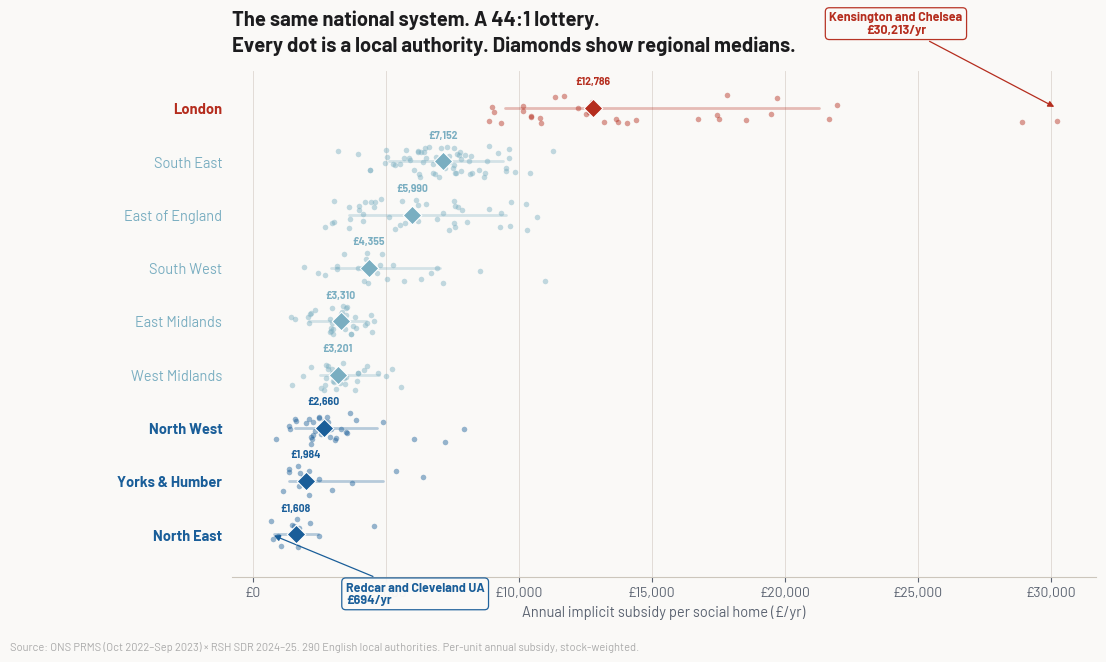
Kensington & Chelsea: £30,213 per social home per year. Redcar & Cleveland: £694. A ratio of 44:1 — not between different countries or systems, but between two English councils operating under identical national rules. Every dot on that chart is a local authority.
Put simply, housing a person in need in Kensington & Chelsea costs the Government 44 times more than it would cost to house them in Redcar & Cleveland. Whether that’s good value for money is a question that warrants an open public conversation.
Why it never corrects itself
The subsidy is mechanically the difference between market rent and social rent. Social rents are set by a national formula almost entirely decoupled from the market (they track CPI and wage growth, not property prices), whereas London market rents track London property prices.
So as London house prices diverge from the North (for the sake of argument, let’s say over the last thirty years) the subsidy gap widens automatically. No bad decisions or wonky policy required. An indefinitely compounding transfer, entirely off any balance sheet.
The stock can’t self-correct either. England builds Social Rent homes at 0.22% of existing stock per year. At that rate, the current geographic distribution lasts 462 years.
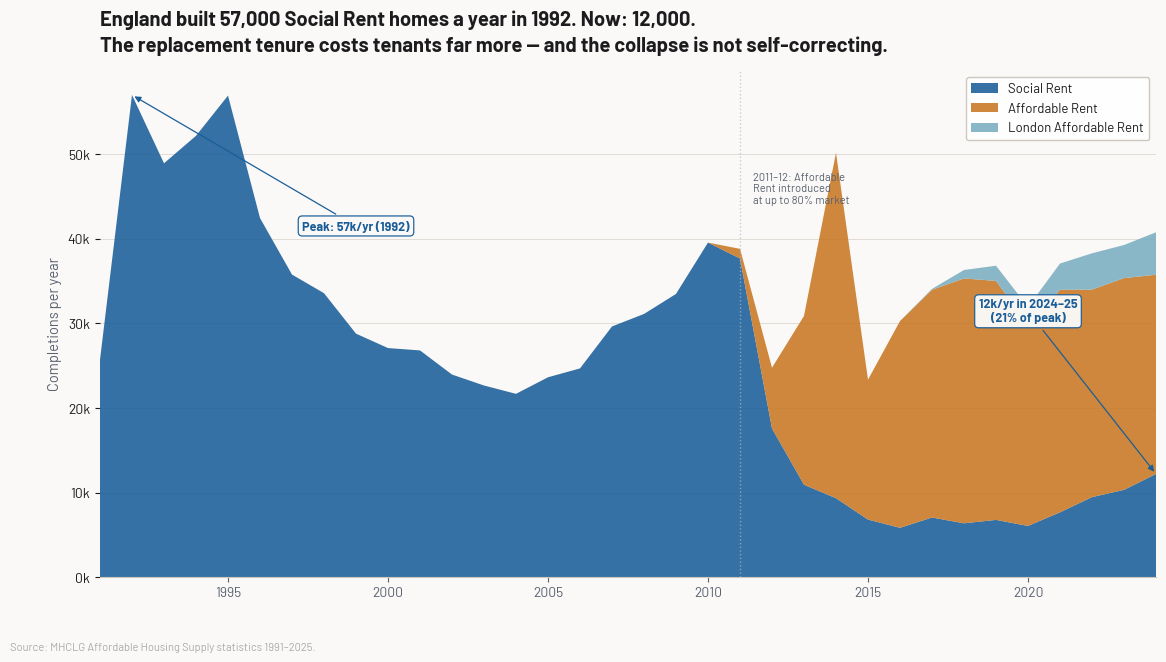
At least new investment is surely seeking to fix this disparity? Right? Right?
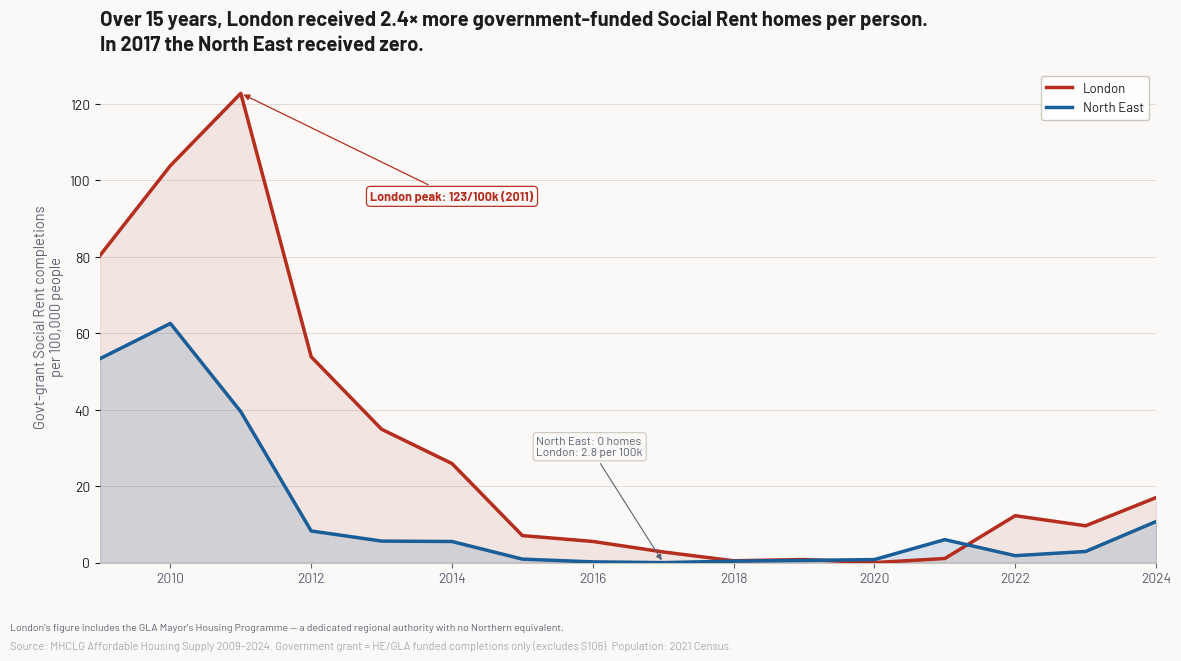
Over the last 15 years, London received 2.4 times more government-funded Social Rent completions per person than the North East. In 2017, the North East received zero. London’s advantage is partly structural: the Greater London Authority runs a dedicated Mayor’s Housing Programme with housing investment powers that no Northern region has any equivalent of.
The employer angle
An obvious argument in favour of this London housing subsidy is that “service workers need to be able to live in London for the city to function”: ultimately cleaners, bus drivers, retail workers and chefs all need to be able to serve the capital.
However, if workers in central London can live at below-market rents because the state is bridging the gap, their employers don’t have to pay wages that reflect what London actually costs. Social housing in London is effectively a labour cost subsidy to London businesses. London is made to be appear more economically competitive than it would otherwise be, and given finite social housing budgets, that comes at the national expense.
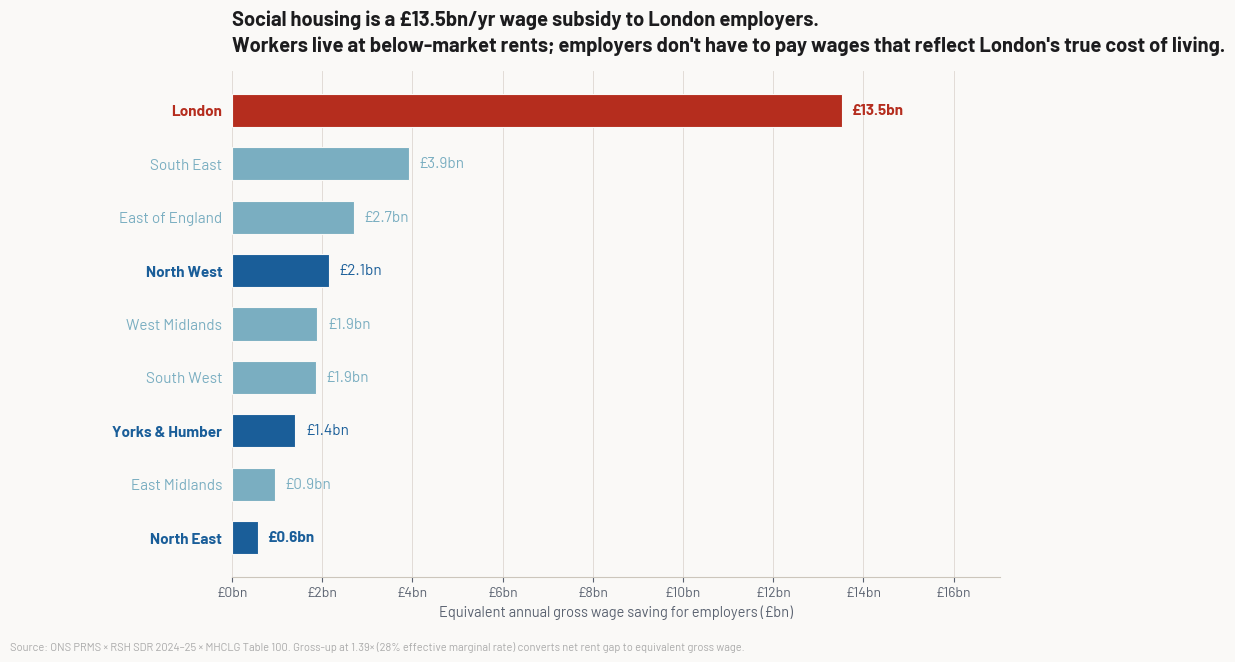
The equivalent annual gross wage saving to London employers is estimated at £13.5 billion per year. If this were an explicit Treasury grant to London businesses, the political scrutiny would be intense. It operates invisibly because it runs through the housing market.
Conclusion
Social housing allows a lucky few (or not so few) to live in areas that they otherwise couldn’t afford to live in. The unlucky majority either have to pay to live there or live elsewhere. Not only does this seem morally unfair, but it is in effect a sizeable regional economic transfer from our poorest areas to our richest.
Fixing this problem is hard, but not impossible. The first stage, however, is in acknowledging and quantifying the problem. Taxpayers have a right to know how their money is being spent, and maintaining a stock of housing in prime residential areas when that money could buy substantially more housing elsewhere is a political choice that many may not agree with.
Data and methodology
All data is from open government sources:
- ONS Private Rental Market Statistics (Oct 2022–Sep 2023) — median private rents by LA and bedroom size
- RSH Statistical Data Return 2024–25 — average social rents for all registered providers
- MHCLG Live Table 100 (March 2024) — dwelling stock by tenure and local authority
- MHCLG Affordable Housing Supply open data (1991–2025) — completions by tenure, LA, year, and funding type
The subsidy is calculated as (market rent − social rent) at the bedroom-size level for each LA, weighted by unit counts. The employer gross-up assumes a 28% effective marginal rate (basic-rate income tax + employee NI).
Full methodology, code, and data: github.com/Kali89/housing-subsidy-analysis
Data year caveat: ONS PRMS covers Oct 2022–Sep 2023; RSH SDR is March 2025. Private rents rose substantially over this period, so the market rent figures likely understate current levels — the subsidy figures are directionally correct but not a precise point-in-time estimate.