Data Science, amongst other things.

Author: Matthew Sharpe (Page 2 of 3)

Bayesian AB Testing using Python

Hi all,

A reasonably big part of the job I do involves running AB tests and I think that’s usually something that falls under the remit of data scientists. Now I could go on and on about the difficulties around tagging tests, choosing test groups, choosing goals and the like. I won’t, but I’ll make at least one point. All of the aforementioned points are very important and are very non-trivial. If you don’t absolutely understand all of the steps a user might take, and how your test will handle these, work a bit harder on that. And outsourcing this problem to your AB testing framework provider…well, I’d not advise it.

Anyway, I recently read this blog post by the engineers over at Lyst and thought it was a really interesting idea. I’m really not a fan of p-values and think that a probability distribution is a much nicer way of communicating a result. With that in mind, the basic logic behind Lyst’s post (if you’ve not got the time/inclination to read it):

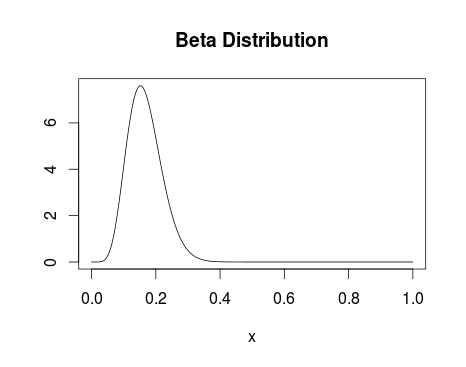
1.) You presumably have a reasonable idea about the distribution of whatever metric you’re plotting – for instance, you’re reasonably confident conversion % lies somewhere between 0 and 25% with the most likely value to be around 15% (as an example). You assume both test groups follow this distribution until you start getting data in to corroborate/contradict that.

Beta Distribution

Beta Distribution with alpha parameter 8 and beta parameter 40.

2.) On getting data in, you update your distribution to take into account these new data points – the distributions evolve with the new data.
3.) Your end result (see below) gives you a probability distribution for the conversion of both test groups.

Bayesian Test Result

The distribution of conversion for two (randomly generated) test datasets

I’d argue the above picture is much clearer than even the best explained set of p-values. It also really clearly lends itself to calculations along the lines of ‘What is the probability that test group A is better than test group B?’ or ‘how sure are you that test group A is 2% better than test group B?’

Enamoured with this new way of reporting test results, I figured I mayerswell build something to do so. Instead of writing something where the test set-up is tied in with the result plotter I wrote my plotter to take input from stdin.

First things first then, I want something to generate a stream of conversion events:

import random
import time

for _ in range(2000):
    group = 'test' if random.random() > 0.3 else 'control'
    if group == 'test':
        convert = 1 if random.random() < 0.16 else 0
    else:
        convert = 1 if random.random() < 0.10 else 0
    print '%s:%d' % (group, convert)

Easy does it – we’ll look at varying those numbers later. For the uninitiated, that’ll give us fairly uneven test groups with reasonably different conversion percentages.

Now for the plotter. I’ll confess, this is still a work in progress. It currently doesn’t assume anything about the test groups, including the names (taking those from the input stream). However, in future I’m hoping to extend the program to be able to perform multivariate Bayesian AB tests. If it appears messy in places, that’s either because I’m expecting the poor coding practices to lead to me having an easier time extending the code to allow multivariate testing, or because I’m a messy coder.

At this point, massive props to this book: it forms the basis of almost all of this code.

import pymc as pm
import numpy as np
from matplotlib import pyplot as plt
import sys

results_dictionary = {}

## Store all our test results in memory - doesn't allow real-time updating and could get a bit serious if we've got a big set of results
for line in sys.stdin:
    if line == '':
        break
    group, conversion = line.strip().split(':')
    try:
        results_dictionary[group].append(int(conversion))
    except:
        results_dictionary[group] = [int(conversion)]

test_group_a, test_group_b = results_dictionary.keys()

## We'll run this twice, once with uniform prior and once with a beta prior
prior_dict = dict((group, pm.Uniform(group, 0, 1)) for group in results_dictionary.keys())
prior_dict_beta = dict((group, pm.Beta(group, 3, 50)) for group in results_dictionary.keys())

@pm.deterministic
def delta(p_A = prior_dict[test_group_a], p_B = prior_dict[test_group_b]):
    return p_A - p_B

@pm.deterministic
def beta_delta(p_A = prior_dict_beta[test_group_a], p_B = prior_dict_beta[test_group_b]):
    return p_A - p_B

## Bernoulli distribution with the events we've got
observations = dict((group, pm.Bernoulli('obs_%s' % str(group), prior_dict[group], value=events, observed=True)) for group, events in results_dictionary.items())
beta_observations = dict((group, pm.Bernoulli('obs_%s' % str(group), prior_dict_beta[group], value=events, observed=True)) for group, events in results_dictionary.items())

## Markov chain Monte-Carlo methods - returning samples from our updated distributions
mcmc = pm.MCMC([prior_dict[test_group_a], prior_dict[test_group_b], delta, observations[test_group_a], observations[test_group_b]])
mcmc_beta = pm.MCMC([prior_dict_beta[test_group_a], prior_dict_beta[test_group_b], beta_delta, observations[test_group_a], observations[test_group_b]])
mcmc.sample(20000,1000)
mcmc_beta.sample(20000,1000)

## Grab all the samples we need
samples = dict((key, mcmc.trace(key)[:]) for key in results_dictionary.keys())
delta_samples = mcmc.trace('delta')[:]
beta_samples = dict((key, mcmc_beta.trace(key)[:]) for key in results_dictionary.keys())
beta_delta_samples = mcmc_beta.trace('beta_delta')[:]

## It's this easy to work out probabilities of success
prob_a_better = (delta_samples < 0).mean()
prob_a_better_beta = (beta_delta_samples < 0).mean()

### Plotting
ax = plt.subplot(321)
plt.hist(samples[test_group_a], histtype='stepfilled', bins=50, alpha=0.85, label='Uniform posterior of %s' % test_group_a, color='#A60628', normed=True)
plt.suptitle('Posterior distributions of %s, %s, and $Delta$ unknowns' % (test_group_a, test_group_b))
plt.title('Uniform posterior of %s' % test_group_a)
plt.autoscale()
#
ax = plt.subplot(323)
plt.hist(samples[test_group_b], histtype='stepfilled', bins=25, alpha=0.85, label='Uniform posterior of %s' % test_group_b, color='#A60628', normed=True)
plt.title('Uniform posterior of %s' % test_group_b)
plt.autoscale()
#
ax = plt.subplot(325)
plt.hist(delta_samples, histtype='stepfilled', bins=25, alpha=0.85, label='Uniform posterior of $Delta$', color='#A60628', normed=True)
plt.vlines(0, 0, 50, linestyle='--', color='black')
plt.title('Uniform posterior of $Delta$')
plt.autoscale()
plt.annotate('Probability %s nis greater nthan %s: %.2f' % (test_group_a, test_group_b, prob_a_better), (0,30))
#
ax = plt.subplot(322)
plt.hist(beta_samples[test_group_a], histtype='stepfilled', bins=25, alpha=0.85, label='Beta posterior of %s' % test_group_a, color='#A60628', normed=True)
plt.title('Beta posterior of %s' % test_group_a)
plt.autoscale()
#
ax = plt.subplot(324)
plt.hist(beta_samples[test_group_b], histtype='stepfilled', bins=25, alpha=0.85, label='Beta posterior of %s' % test_group_b, color='#A60628', normed=True)
plt.title('Beta posterior of %s' % test_group_b)
plt.autoscale()
#
ax = plt.subplot(326)
plt.hist(beta_delta_samples, histtype='stepfilled', bins=25, alpha=0.85, label='Beta posterior of $Delta$', color='#A60628', normed=True)
plt.vlines(0, 0, 50, linestyle='--', color='black')
plt.autoscale()
plt.annotate('Probability %s nis greater nthan %s: %.2f' % (test_group_a, test_group_b, prob_a_better_beta), (0,30))
plt.title('Beta posterior of $Delta$')
#
plt.tight_layout()
plt.show()

Giving us:
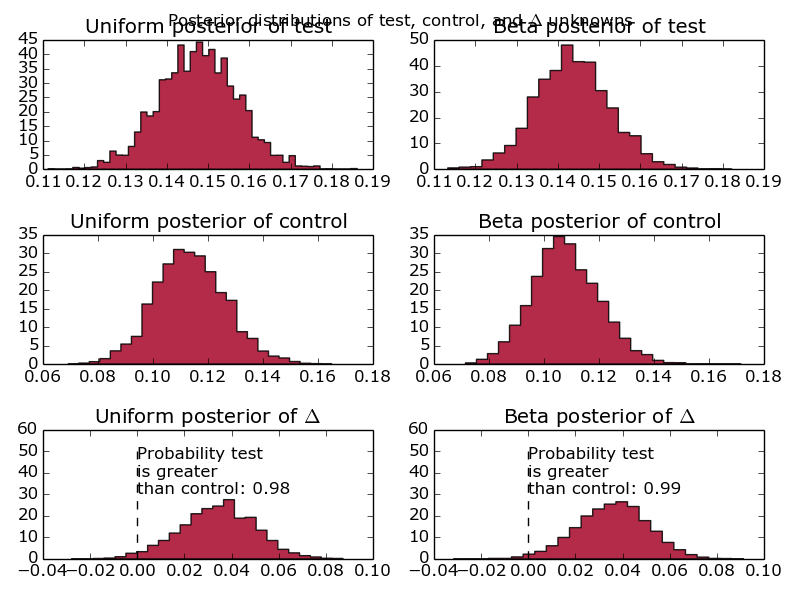
Bayesian AB Testing Graphs

Graphs comparing the conversion of one test group against another, using a Beta distribution and a Uniform distribution as a prior.

First things first, why are there 6 graphs? Well, realistically, given that this is designed to model website conversion, I know what the distribution is likely to look like. Therefore, I say that my initial priors are beta distributions with parameters alpha = 10 and beta = 30. However, I’m well aware that naysayers might quibble with the idea of making such strong assumptions before running the test. Alongside that prior, I’ve included the completely uninformative uniform prior. That basically says that the conversion is equally likely to fall anywhere between 0 and 100%. Another reason for doing this is to show what difference it makes – when we’re looking at < 10 data points, you’ll see fairly big differences between the different prior assumptions. Increase the number of events up past 1000 and the two prior assumptions converge to the same value.

Additionally, we’ve fed in information about the test and control group – where has this delta come from and what’s it all about? That’s simply the difference between the test groups, as a probability distribution. How good is that? Really, that’s what people are interested in and, instead of making them compare two distributions and look at overlaps, we’ve done that for them and presented it as a probability distribution. Well done us.

Move along there.
Finding and Trading Volatile Stocks in Python

Hi all,

Can’t promise that this post won’t be bitty – I’m trying to simultaneously run an SVM and a random forest on a bunch of particle physics data for the Kaggle competition. Check it out, it’s pretty cool. Anyway, my computer is straining under the weight of those calculations and so while that was happening I decided to have a look at stock prices using Python/Pandas again.

After chatting with co-blogger Sean, and based on my (limited, and hilariously bad) experiences of stock trading we decided it’d be interesting to identify volatile stocks that don’t seem to have greatly varying fundamental value. We’re basically looking for the position of a harmonic oscillator in a stock. I’m not graphing that – look it up yourself. The logic being, there’ll be a point at which it it’s profitable to buy a stock like this on a down and sell again when it’s back up. Of course, this requires the assumption that the stock itself isn’t having a fundamental value shift – it’s just suffering from cyclicity. I don’t really know if/how this’ll work but that’s half the fun…

Right, back to it (I’ve caught up with Game of Thrones – get it watched). I’ve thought a reasonable amount about this and have decided our first job is to look at maximizing the following quantity:

frac{Volatility}{Change_{daily}^n Change_{weekly}}

I might also throw in an additional concern – I’d like to be able to enter and exit the market whenever I want – I don’t see this being a big problem for me (I’m not going to be using a lot of money) but it’ll certainly be a concern for bigger players. Let’s cross that bridge if we need to.

So, to start off with, my daily volatility I’m going to define as
frac{sum_{i={day_1}}^{Today} frac{HighPrice_i - LowPrice_i}{ClosePrice_i}}{NumberOfDays}

Hopefully nothing earth-shattering there, just want to see how much it varies over a day. Now while I want the stock price to vary a lot, I want it to head back to where it started. A rapidly increasing/decreasing stock is going to have wildly varying days. However, it’s also going to have a large overall trend. That’s no good for the purposes of finding stocks to buy/sell on a short time period.

Change_{daily} = sqrt{frac{sum_{i={day_1}}^{Today} (frac{ClosePrice_i - OpenPrice_i}{OpenPrice_i})^2}{NumberOfDays}}

Change_{weekly} = sqrt{frac{sum_{i={week_1}}^{Today} (frac{ClosePrice_i - OpenPrice_i}{OpenPrice_i})^2}{NumberOfWeeks}}

Easy does it – the reason I’ve squared the result is basically that I don’t care whether the stock is rising or falling. I’m trying to minimize the overall long-term variations from the mean.

So, how easy is this in Python? Remarkably so. Let’s start off by plotting a scatter graph of some of the more promising stocks.

import numpy as np
from pandas.io.data import DataReader
import pandas as pd
from datetime import datetime
from pylab import savefig

## A list of American Stock Symbols
company_information = pd.read_csv('allcompany.csv')

volatility_measure = []
daily_change_measure = []
weekly_change_measure = []
labels = []

## Let's start out with the biggest 10 companies in my list

for company in company_information.sort(['MarketCap'], ascending=False).head(10)['Symbol']:
    try:
        company_frame = DataReader(company.strip(), 'yahoo', datetime(2013,1,1), datetime.now().date())
        company_frame['Volatility'] = (company_frame['High'] - company_frame['Low'])/company_frame['Close']
        volatility_measure.append(company_frame['Volatility'].mean())
        company_frame['Daily_Change'] = company_frame['Close'].diff()
        daily_change_measure.append(np.sqrt(np.mean(company_frame['Daily_Change']**2)))
        ## Take every 5th row
        weekly_company_frame = company_frame[::5]
        weekly_company_frame['Change'] = weekly_company_frame['Close'].diff()
        weekly_change_measure.append(np.sqrt(np.mean(weekly_company_frame['Change']**2)))
        labels.append(company.strip())
    except:
        print "Problem parsing %s" % company.strip()

for i in range(1,7):
    change_metric = [daily * (weekly ** (1./i)) for daily, weekly in zip(daily_change_measure, weekly_change_measure)]
    ax = plt.subplot(3,2,i)
    plt.xlabel('Log of overall change metric')
    plt.ylabel('Volatility metric')
    plt.title('Weekly power %.2f' % float(1./i))
    plt.scatter(change_metric, volatility_measure, c = volatility_measure, cmap=plt.get_cmap('Spectral'), label='Weekly power %.2f' % float(1./i))
    for label, x, y in zip(labels, change_metric, volatility_measure):
        plt.annotate(label, (x,y), xytext=(0,8), textcoords='offset points')

    plt.gca().set_xscale('log')
    plt.gca().legend_ = None

plt.suptitle('Daily Volatility of Stocks versus Overall Trend')
plt.tight_layout()
plt.show()
savefig('StockVolatility.png')

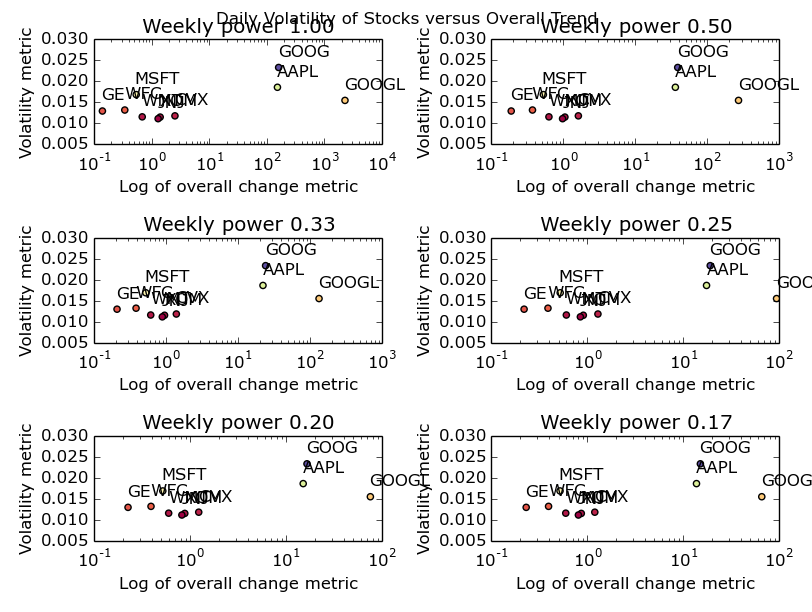
OK – it’s not especially pretty but it gives us the following picture:

Stock Volatility

The 10 biggest US stocks – their daily & weekly change versus their daily volatility

You could also make a fair point that I’ve formatted it poorly. Open it up as big as your browser will let you and you’ll be able to see it nicely. Or, just run the code and create your own picture. It’s dead easy. I promise.

So what can we infer from that picture? I’m going to go ahead and say not a huge deal. Apple & Google have made some crazy ups and downs over the last year or two (mostly ups) and hence I’ve been forced to use a log plot. Other than that, we can see a cluster of the remaining companies with GE seeming the most stable all round. One point I’d like to make now: by defining my metrics in such a way that they don’t really match to anything in reality, I’ve lost the ability to understand exactly what I’ve plotted. What I’m trying to say, is that the log of an overall change metric isn’t an intuitive quantity. Usually, it’s a good idea to pick metrics that have a fairly firm grounding in the real world unless you’ve got a really good reason not to. In my case, my reason is that all I’m trying to do here is identify stocks in the upper left most corner – I don’t care what their values are yet.

I’d also like to make the point here that for this data set, the change of power associated with the weekly metric seems to make no difference. I put it there to express the idea that we’re likely to want a different weighting on the daily and weekly variability depending on how often we want to trade the stock. As I’m hoping to trade multiple times daily, the daily variability is more important to me than the weekly variability (hence my choice of fractional powers of the weekly variable). If you’re looking at trading less regularly, change your parameters accordingly.

Now I’m going to go out on a limb and say that, when looking for daily volatility, the biggest companies in America aren’t the place to go looking. I’m sure that the algorithmic trading people are all over this kind of trade with fancy-pants C++ code designed to execute multiple trades/second. To do this at a reasonably large scale (and to overcome transaction/infrastructure costs) I’m going to say those guys will play with these big companies where a purchase of £1 million+ of shares isn’t going to be such a big deal. Playing in those markets must be the equivalent of going barracuda fishing with a thumb tack and a tie. I think we should start our search towards the lower market caps and work our way up until we’ve got a few hopefuls.

volatility_measure = []
daily_change_measure = []
weekly_change_measure = []
labels = []

for company in company_information[company_information['MarketCap'] > 10000000].sort(['MarketCap']).head(25)['Symbol']:
    try:
        company_frame = DataReader(company.strip(), 'yahoo', datetime(2013,1,1), datetime.now().date())
        company_frame['Volatility'] = (company_frame['High'] - company_frame['Low'])/company_frame['Close']
        volatility_measure.append(company_frame['Volatility'].mean())
        company_frame['Daily_Change'] = company_frame['Close'].diff()
        daily_change_measure.append(np.sqrt(np.mean(company_frame['Daily_Change']**2)))
        ## Take every 5th row
        weekly_company_frame = company_frame[::5]
        weekly_company_frame['Change'] = weekly_company_frame['Close'].diff()
        weekly_change_measure.append(np.sqrt(np.mean(weekly_company_frame['Change']**2)))
        labels.append(company.strip())
    except:
        print "Problem parsing %s" % company.strip()

for i in range(1,7):
    change_metric = [daily * (weekly ** (1./i)) for daily, weekly in zip(daily_change_measure, weekly_change_measure)]
    ax = plt.subplot(3,2,i)
    plt.xlabel('Log of overall change metric')
    plt.ylabel('Volatility metric')
    plt.title('Weekly power %.2f' % float(1./i))
    plt.scatter(change_metric, volatility_measure, c = volatility_measure, cmap=plt.get_cmap('Spectral'), label='Weekly power %.2f' % float(1./i))
    for label, x, y in zip(labels, change_metric, volatility_measure):
        plt.annotate(label, (x,y), xytext=(0,8), textcoords='offset points')

    plt.gca().set_xscale('log')
    plt.gca().legend_ = None
    plt.autoscale(tight=True)

plt.suptitle('Daily Volatility of Stocks versus Overall Trend')
plt.tight_layout()
plt.show()
savefig('SmallerCompanies.png')
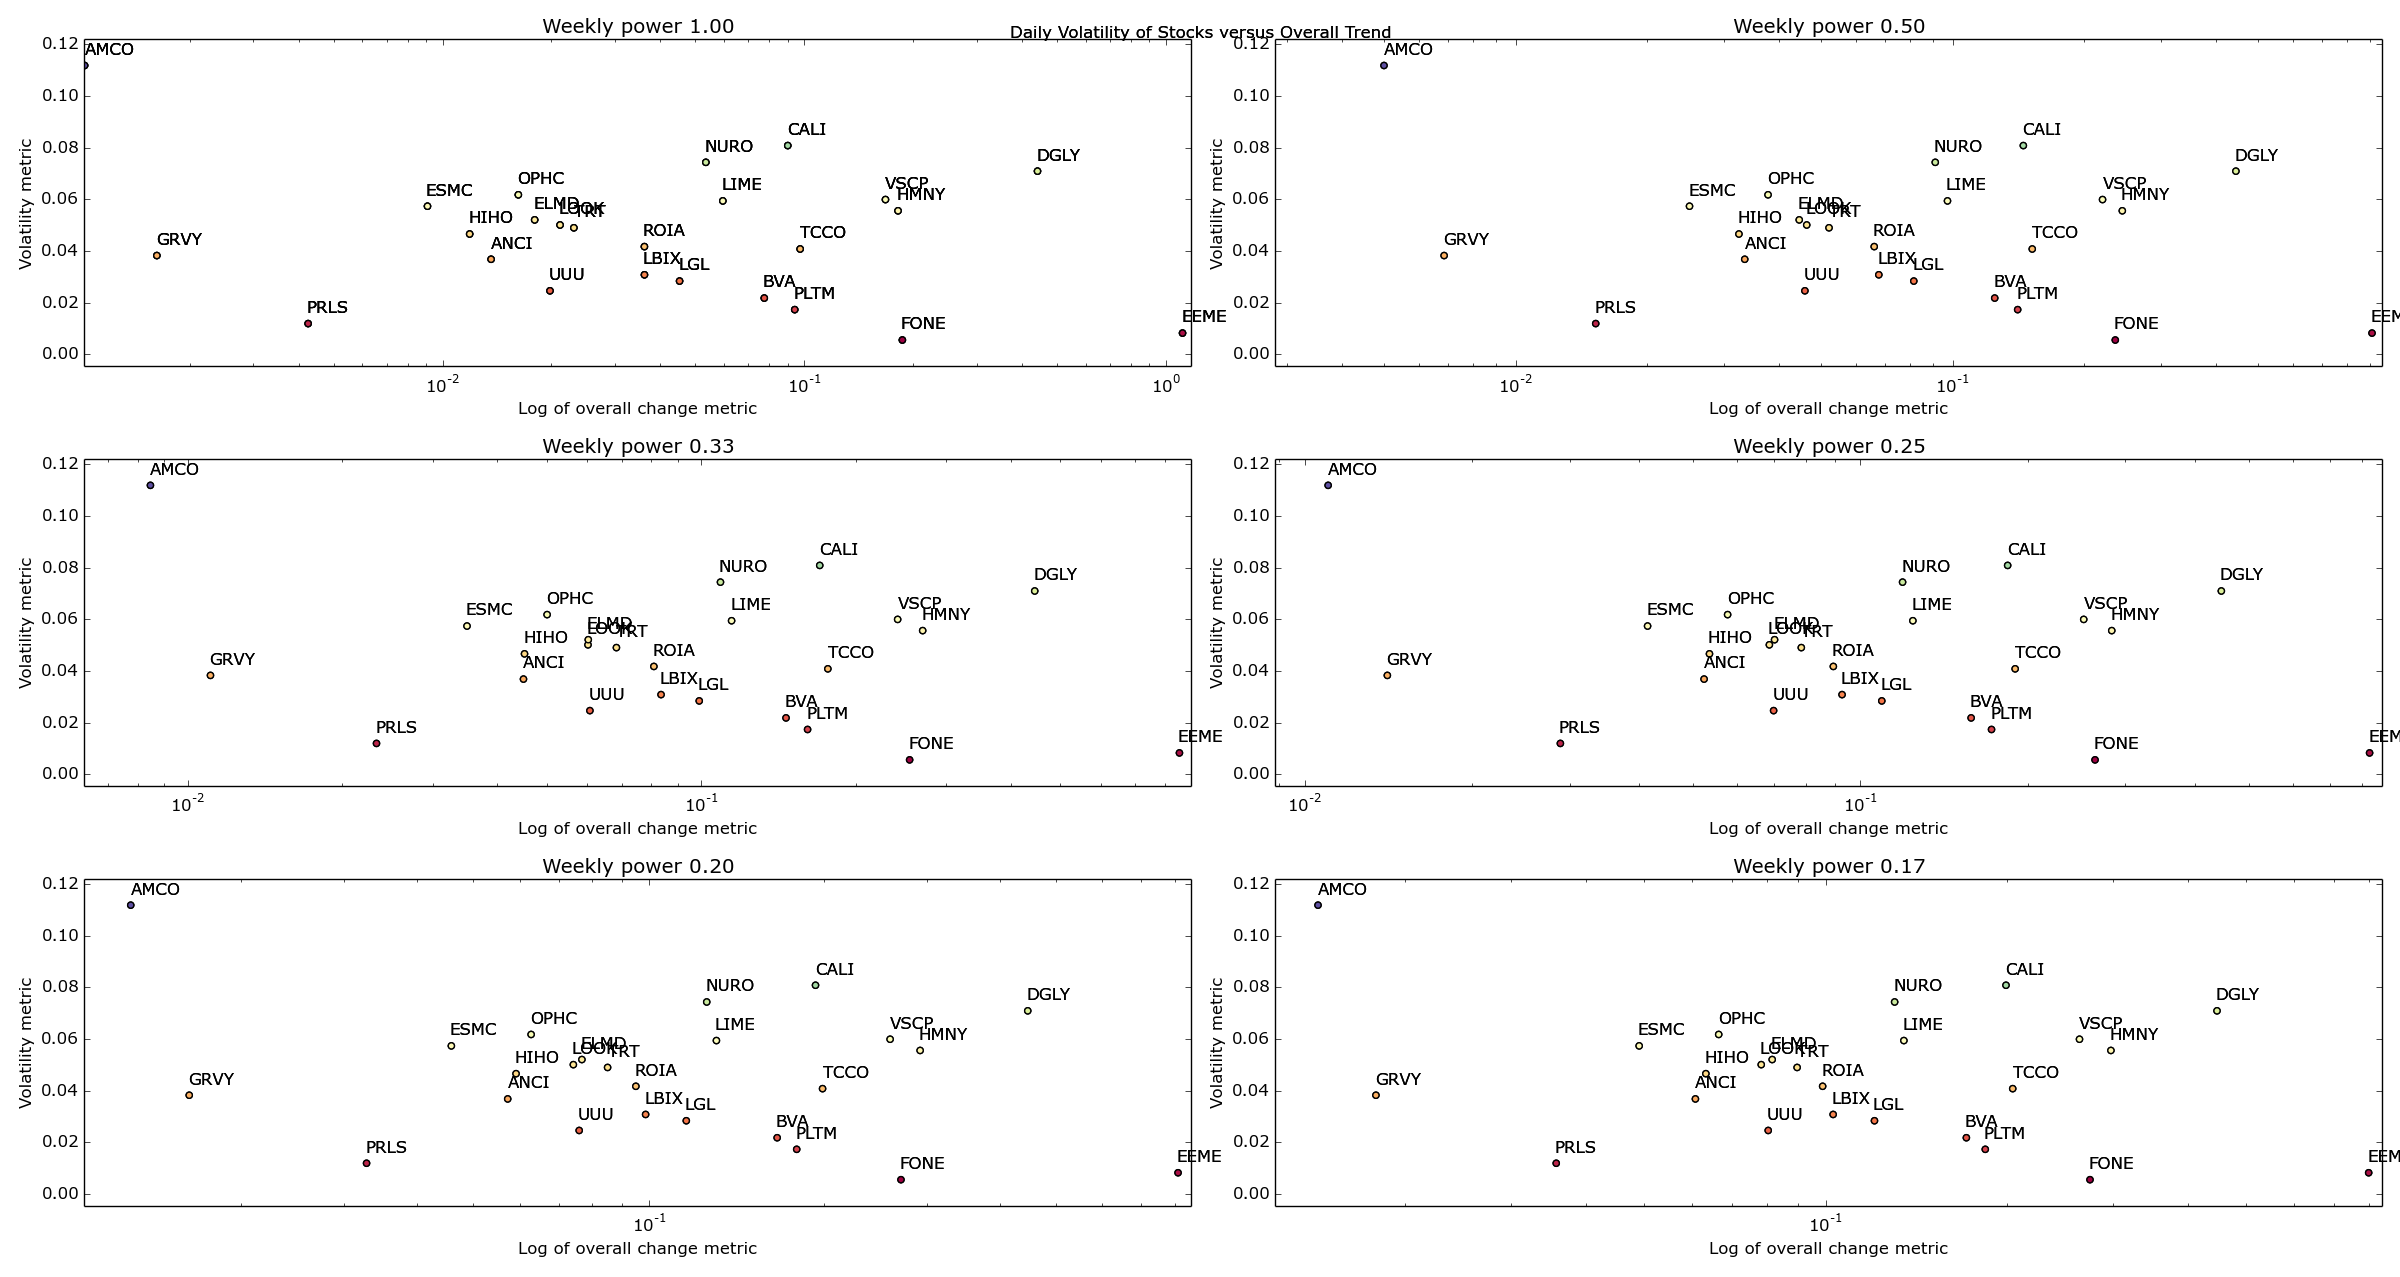
Small Companies Volatility

Volatility versus overall change for American companies with Market Caps > $10,000,000

Well bugger me. I don’t know about you but that looks pretty cool to me. Ignore all the gumph in the middle and look at the outliers – AMCO, GRVY, PRLS, DGLY and EEME. These are great examples of companies that are going to be either maximums or minimums for our given metric.

OK – I’m going to call it a night for now but just think of the possibilities open to us now! We can change our date ranges, play around with our metrics and loop through as many stocks as we can find symbols for (harder than you’d think!) until we’ve got a reasonable amount of stocks that we think are great candidates for regularly buying and selling.

Next time, I’ll finalize my list of stocks and hopefully start to gain an idea of when one of these stocks becomes a buy, and when it becomes a sell. That sounds fairly difficult actually. Ah well, that’s the fun.

Winter is coming.

Hadoop wordcount in Python

Hi all,

There’ll be a follow up post to this detailing how to run a mapreduce using Eclipse and Java but, as I’ve found myself in permissions hell in running that, I’ll go with the easy one first. Hadoop comes with a streaming jar that allows you to write your mappers and reducers in any language you like – just take input from stdin and output to stdout and you’re laughing. I’ll show you how to achieve this using Python.

Cluster Set-up

I’m going to assume you’ve followed a tutorial and have got Hadoop installed and working – if you haven’t, follow one (maybe even mine) and then come back here. Make sure you’ve got HDFS and Yarn running by executing the following commands:

su - hduser ## Only need this if you created a user called hduser to interface with Hadoop
cd /usr/local/hadoop ## If you followed the tutorial - otherwise, wherever your Hadoop home directory is
sbin/start-all.sh

Let’s see about putting a text file into HDFS for us to perform a word count on – I’m going to use The Count of Monte Cristo because it’s amazing. Honestly, get it read if you haven’t. It’s really really good. Anywho, enough fandom – this little command will download the whole book and stick it into whichever directory you happen to be in when you run the command.

 cd ~
wget -O 'count_of_monte_cristo.txt' http://www.gutenberg.org/cache/epub/1184/pg1184.txt

Now we’ve got the file in our home directory (really, it was that easy, check it out if you don’t believe me – then read the book). However, that’s not in HDFS – we need to explicitly put it there. I’m going to create a directory in HDFS called input and then put the file in there:

/usr/local/hadoop/bin/hadoop fs -mkdir /input
/usr/local/hadoop/bin/hadoop fs -put ~/count_of_monte_cristo.txt /input

Has it worked?

Run this command:

 /usr/local/hadoop/bin/hadoop fs -ls /input | grep count_of_monte_cristo | awk -F '/' '{print $3}' | cut -d '.' -f1 

If it returns a warning followed by ‘count_of_monte_cristo’ then you’re in the money. If you don’t understand the commands above, don’t worry. But do find out about them.

Otherwise, drop me a comment and I’ll see what can be done.

The Mapper

With this bit of code we’re going to go over every line in the text file and output the word and the number of instances of that word (one, for now) – easy does it:

#!/usr/bin/python

import sys

for line in sys.stdin:
    for word in line.strip().split():
        print "%st%d" % (word, 1)

Save that file as something sensible at a sensible location – I’m going to use /home/hduser/word_mapper.py.
Also, make sure it’s executable:

chmod +x /home/hduser/word_mapper.py

Has it worked?
Run this little beaut’ of a command:

 /usr/local/hadoop/bin/hadoop fs -cat /input/count_of_monte_cristo.txt | /home/hduser/word_mapper.py 

If you’ve gone maverick and used a different filename or file location then that’s fine – just substitute that in where I’ve used

/home/hduser/word_mapper.py

. If you’ve gone maverick but don’t really know what you’re doing and don’t know what I’ve just said, that’s basically on you. Keep trooping on, you’ll get there.

Either way, don’t stop until that code outputs a stream of words followed by the number 1. Don’t worry – you can stop it by pressing Ctrl and C together.

The Reducer

We’ve got ourselves a nice stream of words. The Hadoop streaming jar will take care of the sorting for us (though we can override the default behaviour should we choose) so we just need to decide what to do with that stream of words. I’m going to propose this:

#!/usr/bin/python

import sys

current_word = None
current_count = 1

for line in sys.stdin:
    word, count = line.strip().split('t')
    if current_word:
        if word == current_word:
            current_count += int(count)
        else:
            print "%st%d" % (current_word, current_count)
            current_count = 1

    current_word = word

if current_count > 1:
    print "%st%d" % (current_word, current_count)

Follow the code through and try to think of the different cases it’s trying to catch. The first and last lines are tricky but play around with it – what happens if I just feed a file containing one word? What about a file with no duplicate words? Think about all the different cases and hopefully – the above code handles them all as you’d expect. If not, please let me know. That’d be real embarrassing.

Has it worked?

Make sure that file is executable:

 chmod +x /home/hduser/word_reducer.py 

Run this:

 /usr/local/hadoop/bin/hadoop fs -cat /input/count_of_monte_cristo.txt | /home/hduser/word_mapper.py | head -n 100 | sort | /home/hduser/word_reducer.py 

If everything’s gone to plan you should see a bunch of lines and associated counts – some of them should be non-one.

Super.

Run the Mapreduce

This is what you’ve been waiting for. Well – it’s what I’ve been waiting for at least. Run this command and you’ll basically be a Hadoop hero:

 cd /usr/local/hadoop
bin/hadoop jar share/hadoop/tools/lib/hadoop-streaming-2.4.0.jar -files /home/hduser/word_mapper.py,/home/hduser/word_reducer.py -mapper /home/hduser/word_mapper.py -reducer /home/hduser/word_reducer.py -input /input/count_of_monte_cristo.txt -output /output

And off it goes – enjoy watching your mapreduce race through at what I’m sure is a barely tolerable crawl.

Has it worked?

Run this beauty:

 /usr/local/hadoop/bin/hadoop fs -cat /output/part-00000 

If you see a stream of likely looking results – you’re golden. If you want to get the file out of HDFS for inspection run something like this:

 /usr/local/hadoop/bin/hadoop fs -get /output/part-00000 /home/hduser/monte_cristo_counted.txt
less /home/hduser/monte_cristo_counted.txt 

Hope that’s worked well for you – it’s not the most glamorous of Hadoop jobs but it’s a good stepping stone. In a post coming to you soon I should be able to show you how to get Eclipse set up to run Hadoop jobs and give you an example or two in Java.

(Pseudo) Distributed Wishes

Installing Eclipse 4.2.3 (Kepler) on Ubuntu 14.04

Hi all,

If you’ve followed any of my other posts you’ll know I recently wiped my OS (something I do alarmingly regularly) – as such, I’m reinstalling a bunch of stuff. Given that I do this so often, it makes sense for me to have a repository of tutorials for doing so!

Today I’m on Eclipse – I’m by no means an Eclipse regular. I do most of my coding in Python and find Vim works well enough for most of what I need to do. RStudio for R, Vim/IPython for Python, but when I’m doing anything in Java (inc. Android stuff) I’ll go with Eclipse. Now installing Eclipse on Ubuntu is really easy – there’s a version in the software centre that’ll work just fine. However, if you want a more up to date version then there’s a degree of hacking about required. Let’s go:

Check you’ve got Java installed

Give this command a cheeky little run (from terminal – press Ctrl + shift + t to get terminal on the screen):

which java
java -version

If they both worked you should have seen the path to where your Java is installed (mine was /usr/bin/java) and the version of Java you have installed (1.7 OpenJDK for me). If both commands worked (gave you a path and a version) then excellent, carry on wayward son. It doesn’t matter if your results are different to mine, just keep trooping on. If they didn’t work, you’ll want to install Java before continuing. I’ll not deal with that here but I mention how to do so in my post on installing Hadoop on Ubuntu.

Download Eclipse

As with installing Hadoop, there are a couple of ways to do this. I’m going to advise heading on over to the Eclipse download link:

Eclipse

Pick the top version (Eclipse standard) and decide which bit version you want (32 or 64). If you don’t know which you should be using, I’d advise running the following command:

 uname -a | awk '{print $12}' 

If the output is

x86_64

you’ll likely want 64 bit,

i386

tells me you’re after 32 bit. If it says something else entirely then I’m flummoxed – have a Google around to find out what bit your Ubuntu installation is.

If you’ve not got a GUI then I’m going to decide you shouldn’t be installing Eclipse. Wget the .tar.gz file if that’s you but really, what are you doing? Actually, maybe you’re setting up a bunch of computers over SSH which will have monitors in the future but don’t now. OK – wget this link if you’re on 64 bit:

http://www.eclipse.org/downloads/download.php?file=/technology/epp/downloads/release/kepler/SR2/eclipse-standard-kepler-SR2-linux-gtk-x86_64.tar.gz&r=1

and this link if you’re not:

http://www.eclipse.org/downloads/download.php?file=/technology/epp/downloads/release/kepler/SR2/eclipse-standard-kepler-SR2-linux-gtk.tar.gz&r=1

Installing Eclipse

At this point I’m assuming you’ve got a tarred Eclipse in your downloads folder and you know where Java is installed.

Open up a terminal, head over to your downloads directory and untar the Eclipse file:

cd ~/Downloads
tar -xzf eclipse-standard-kepler-SR2-linux-gtk-x86_64.tar.gz

Next we’re going to put it into a more sensible directory and make it easily launchable from terminal:

sudo mv eclipse /usr/local/eclipse
sudo ln -s /usr/local/eclipse/eclipse /usr/bin/eclipse

At this point, if you could kindly run the following command from terminal:

 eclipse 

I’d expect you to see Eclipse pop up and for you to be able to start developing.

Estimating Pi using the Monte Carlo Method in Python

Hi all,

If you were especially upset then I’m sorry it’s been a while since I posted – I discovered Game of Thrones. In a later post I’ll chart the effect of Game of Thrones on overall productivity. I think there’ll be some unsurprising results. Anyway, I spend a reasonable amount of time on the train with my (oft abused) laptop each morning/evening; I don’t have the internet and I don’t have any textbooks so it’s basically a question of what I can work on given only the documentation on my computer and whatever I can remember about programming/maths/stuff.

I was having a think and remembered that you could estimate Pi using a Monte Carlo method and thought like that sounded like the sort of thing I should do. The logic is basically as follows:

Let’s draw a square of side length 2r and a circle centred exactly in the middle of the square with radius r. A well organised blogger would show you a diagram of this set-up, screw it, this is the code to do it and this is what it looks like:

import matplotlib.pyplot as plt
fig = plt.figure()
axis = fig.add_subplot(1,1,1)
circle = plt.Circle((0,0), 1)
axis.add_patch(circle)
axis.set_xlim([-1,1])
axis.set_ylim([-1,1])
axis.set_title('A Circle in a Square')
plt.show()
A Circle in a Square

A Circle in a Square

Brilliant – was it worth it? Probably not. But there you have it – with that set up we can now start the Monte Carlo bit. We’ll throw darts at that picture randomly; you’d expect the number of darts in the circle to be proportional to the area of the circle and the number of darts in the square to be proportional to the area of the square. Using that fact and the formulae for the areas of a circle and a square you can estimate Pi using the ratio of darts in the circle and in the square.

Sound good? It’s fairly easy to run this in Python and graph the output using Matplotlib. You’ll see I’ve used Object Oriented Python for this particular exercise, I don’t really know why. Especially because I had a chance to use inheritance and didn’t. Well done me. I’ve let everybody down. Anyway – this is the code I came up with and the graph below shows what I ended up with:

#!/usr/bin/python

import numpy as np
import math
import matplotlib.pyplot as plt

"""
Calculate pi using Monte-Carlo Simulation
"""

"""
First - the maths:
A circle has area Pi*r^2
A square wholly enclosing above circle has area 4r^2
If we randomly generate points in that square we'd expect the ratio of points in the square/points in the circle to equal the area of the square divided by the circle.
By that logic n_in_sq/n_in_cir = 4/Pi and so Pi = (4 * n_in_cir)/n_in_sq
"""

class pi_calculator(object):

    def __init__(self, radius, iterations):
        self.radius = radius
        self.iterations = iterations
        self.square = square(radius)
        self.circle = circle(radius)

    def scatter_points(self):
        for _ in range(self.iterations):
            point_x, point_y = ((2*self.radius) * np.random.random_sample(2)) - self.radius
            self.square.increment_point_count(point_x, point_y)
            self.circle.increment_point_count(point_x, point_y)

    def return_pi(self):
        return (4.0*self.circle.return_point_count())/self.square.return_point_count()

    def calculate_accuracy(self, calc_pi):
        absolute_error = math.pi - calc_pi
        percent_error = 100*(math.pi - calc_pi)/math.pi
        return (absolute_error, percent_error)

    def return_iterations(self):
        return self.iterations

class square(object):

    def __init__(self, radius):
        self.radius = radius
        self.lower_x = -radius
        self.lower_y = -radius
        self.upper_x = radius
        self.upper_y = radius
        self.point_count = 0


    def in_square(self, point_x, point_y):
        return (self.upper_x > point_x > self.lower_x) and (self.upper_y > point_y > self.lower_y)


    def increment_point_count(self, point_x, point_y, increment = 1):
        if self.in_square(point_x, point_y):
            self.point_count += increment

    def return_point_count(self):
        return self.point_count

class circle(object):

    def __init__(self, radius):
        self.radius = radius
        self.point_count = 0

    def in_circle(self, point_x, point_y):
        return point_x**2 + point_y**2 < self.radius**2

    def increment_point_count(self, point_x, point_y, increment=1):
        if self.in_circle(point_x, point_y):
            self.point_count += increment

    def return_point_count(self):
        return self.point_count


if __name__ == '__main__':
    axis_values = []
    pi_values = []
    absolute_error_values = []
    percent_error_values = []
    for _ in range(1,3000,30):
        pi_calc = pi_calculator(1, _)
        pi_calc.scatter_points()
        print "Number of iterations: %d    Accuracy: %.5f" % (pi_calc.return_iterations(), math.fabs(pi_calc.calculate_accuracy(pi_calc.return_pi())[0]))
        axis_values.append(_)
        pi_values.append(pi_calc.return_pi())
        absolute_error_values.append(math.fabs(pi_calc.calculate_accuracy(pi_calc.return_pi())[0]))
        percent_error_values.append(math.fabs(pi_calc.calculate_accuracy(pi_calc.return_pi())[1]))

    improvement_per_iteration = [absolute_error_values[index] - absolute_error_values[index-1] for index, value in enumerate(absolute_error_values) if index > 0]
    fig = plt.figure()
    fig.suptitle('Calculating Pi - Monte Carlo Method')
    ax1 = fig.add_subplot(2,2,1)
    ax2 = fig.add_subplot(2,2,2)
    ax3 = fig.add_subplot(2,2,3)
    ax4 = fig.add_subplot(2,2,4)
    plt.subplots_adjust(wspace=0.3, hspace=0.3)
    ax1.set_xticklabels([str(entry) for entry in axis_values[::len(axis_values)/5]], rotation=30, fontsize='small')
    ax1.set_xlabel('Iterations')
    ax1.set_ylabel('Calculated value of Pi')
    ax1.plot(pi_values, 'k')
    ax1.plot([math.pi for entry in axis_values], 'r')
    ax2.set_ylabel('Absolute error')
    ax2.set_xticklabels([str(entry) for entry in axis_values[::len(axis_values)/5]], rotation=30, fontsize='small')
    ax2.set_xlabel('Iterations')
    ax2.plot(absolute_error_values, 'k', label="Total Error")
    ax3.set_ylabel('Absolute percentage error (%)')
    ax3.set_xticklabels([str(entry) for entry in axis_values[::len(axis_values)/5]], rotation=30, fontsize='small')
    ax3.set_xlabel('Iterations')
    ax3.plot(percent_error_values, 'k', label="Percent Error")
    ax4.set_ylabel('Absolute improvement per iteration')
    ax4.set_xticklabels([str(entry) for entry in axis_values[::len(axis_values)/5]], rotation=30, fontsize='small')
    ax4.set_xlabel('Iterations')
    ax4.plot(improvement_per_iteration, 'k', label="Absolute change")
    plt.savefig('pi_calculation.png')
    plt.show()


giving us:

Monte Carlo estimation of Pi - an Investigation

Monte Carlo estimation of Pi – an Investigation

I can only apologise for any dodgy code in there – in my defence, it was early in the morning. As you can see, it only takes around 100 ‘darts thrown at the board’ to start to see a reasonable value for Pi. I ran it up to about 10,000 iterations without hitting any significant calculation time. The fourth graph doesn’t really show anything interesting – I just couldn’t think of anything to put there.

That’ll do for now – I built something that’ll stream tweets on the Scottish Independence Referendum but don’t know what to do with it yet; there’ll likely be some sort of blog post. There’s a chance I’ll do some sentiment analysis but I’m not sure yet.

When you play the Game of Thrones, you win or you die.

UK Housing Data – Data Munging for Machine Learning

Hey all,

I’ve been tentatively threatening to write this post for a while now and I’ve been itching to do a bit of machine learning – I’m going to be walking through the steps required to run linear regression and an SVM on our housing sale data to try to predict future house sale prices. I’m not overly confident that it’s going to give us a huge deal of predictive power – any example I see online uses useful things like area of house or number of bedrooms. All I’ve got is when you sold it, where you sold it and the type of house (new or old, detached or terraced, freehold or leasehold) e.t.c. Not to worry – it’ll be a blast all the same.

First things first, which machine learning technique should we use? We’ll be using a supervised algorithm as we have a labelled training set (we can tell our classifier what the right answer is). We’re looking at a regression problem, not a classification problem (we’ve trying to predict a continuous variable, not a discrete one). All in all, that’s screaming linear regression to me. As an additional bonus though, I also happen to know that SVMs work very well for this kind of problem and have used Libsvm for similar things in the past.

In terms of the bits of kit I’ll be using – let’s start off, as I always seem to, in bash.

cut -d ',' -f3- pp-all.csv | cut -d ',' -f1-13 | tr -d '"' > pp_all_for_weka.txt 

Just a bit of formatting but, if you’ve followed the posts through then you’ll have pp-all.csv on your computer. If you’ve not see here for how to get it.

Now we’re here, you may notice the strange filename – Weka is a machine learning library for Java. We’ve been using it a bit at work recently and I fancied getting a bit more experience of it. I’ll be using Weka for the linear regression; I’ve not got the heart to do a Weka installation post just yet (it’s not difficult, I’m just tired) but will do one if there’s any demand. I’m going to be using LibSVM for my support vector machine calculations and again, not going to talk you through the install unless you fancy it. The reason I’ve told you about that is because I’m now going to convert my CSV file into an ARFF file and a libsvm formatted file. While I’m at it, I’m going to convert all of my values (postcodes, dates e.t.c.) into numbers. Doing this allows me to very easily feed this data set into the above programs and get an answer out relatively easily.

Could we write the algorithms ourselves? Sure – but not nearly as well as they’ve already been written. Sidebar: if you’re interested in understanding how all these algorithms work I’d encourage you to check out Andrew Ng’s lecture series on Coursera. It’s excellent.

Anyway, to run the conversion and to output the two different files I wrote the following Python script:

#!/usr/bin/python

class mapping_dictionary(object):

    def __init__(self, output_file, svm_file):
        self.mapping = {}
        self.mapping_count = {}
        self.column_names = ['date', 'postcode', 'f_map', 'n_map', 'l_map', 'addy', 'addy1', 'addy2', 'addy3', 'addy4', 'addy5', 'addy6', 'price']
        self.writer_file = open(output_file, 'w')
        self.svm_file = open(svm_file, 'w')

    def shut_file(self):
        self.writer_file.close()
        self.svm_file.close()

    def add_to_dictionary(self, column, key):
        if column not in self.mapping:
            self.mapping[column] = {}
            self.mapping_count[column] = 0
        if key not in self.mapping[column]:
            self.mapping[column][key] = self.mapping_count[column]
            self.mapping_count[column] += 1

    def interpret_list(self, listy):
        if len(listy) != len(self.column_names):
            print "Error - unexpected number of columns in the line: %d" % len(listy)
            return None
        for index, value in enumerate(listy):
            if index == 12:
                try:
                    value = int(value.strip().strip('n'))
                except:
                    break
            self.add_to_dictionary(self.column_names[index], value)
        self.write_to_file(listy)
        self.write_libsvm_file(listy)

    def write_to_file(self, listy):
        string_to_write = ','.join([str(self.mapping[self.column_names[index]][entry]) for index, entry in enumerate(listy) if index != 12])
        string_to_write += ",%sn" % str(listy[-1])
        self.writer_file.write(string_to_write)

    def write_libsvm_file(self, listy):
        string_to_write = ' '.join([str(index + 1) + ":" + str(self.mapping[self.column_names[index]][entry]) for index, entry in enumerate(listy) if index != 12])
        string_to_write = str(listy[-1]) + " " + string_to_write + "n"
        self.svm_file.write(string_to_write)

mapping = mapping_dictionary('nice_weka_output.txt', 'nice_libsvm_output.txt')
with open('pp_for_weka.txt', 'rb') as f:
    while True:
        line = f.next()
        mapping.interpret_list(line.strip().strip('n').split(','))
    mapping.shut_file()

A reasonable amount of Python happening there – if you were worrying about it, I really wouldn’t. All we’re doing is replacing every field (apart from price) with an integer and outputting that in two different formats as we work our way through the file. If I was being thorough I’d remove the hardcoded list at the top, require a header row, take the filenames as command line arguments and then it’d work as a general tool for formatting CSVs as libsvm and arff files. Actually, that doesn’t sound like a bad idea at all.

Now you’ve got your input files, it’s child’s play to run our algorithms to create models that we can pass new data to. I’ll create a separate post detailing the output of the above two classifiers but it looks like I’ll have to leave them running through the night!

Until then.

Best Housing Investments of the last 20 years

Hey all,

So from that long list I posted I’ve decided I’m most interested in the fastest growing and falling towns in the UK, as measured by the average house selling price. Once we’ve got a bunch of hot/not towns we might even be able to have a look at what these towns looked like before their boom. The hope is then that we’ll be able to find towns in that situation right now and boom, we’re housing moguls.

Given my poor excuse for hardware, we’ll have to start in bash:

 awk -F, '{print $3"-"$4"-"($(NF-3))}' pp-all.csv | tr -d '"' | cut -d '-' -f1,2,3,5 | tr '-' 't' | awk '{summary_array[$2"-"$3"-"$4] += $1; count_array[$2"-"$3"-"$4]++} END {for (region in summary_array) print region"t"summary_array[region]/count_array[region]}' | tr '-' 't' | sort -nk1 -nk2 > average_sale_price_by_town_and_month.txt 

where pp-all.csv is all the UK housing data as downloaded from data.gov.uk. The format of the data and what the above code does is inferrable from the following R code:

library(reshape2)
library(plyr)
library(ggplot2)
myData <- read.csv('average_sale_price_by_town_and_month.txt', header=F, sep='t')
colnames(myData) <- c("Year", "Month", "Town", "Average_Price")
## Let's not make the same mistakes as we did last time - which data should we remove pre-analysis?
summary(count(myData, c('Town'))$freq)
## From that, I'm going to say let's remove any town without 229 points.
myData <- myData[!(myData$Town %in% levels(myData$Town)[(count(myData, c('Town'))$freq < 229)]),]

I’m going to break out of code mode to explain that last line because it is horrible. I’m first grouping my data by town and counting the number of entries – in SQL this’d be SELECT count(date) FROM myData GROUP BY Town . I’m then comparing every entry in the list to 229 (the max number of points each town can have) and producing a logical list of the same size as the number of towns indicating whether the town at that index has a full complement of points. levels(myData$Town) gives me a list of all the towns which is placed against the previously calculated logical list – only towns matching a TRUE are kept. At that point, we’ve got a list containing all the towns we want to keep – myData$Town %in% compares the Town column of myData against this list and acts like a SQL where clause. Finally, in confusing developments, I’ve inverted all of the above logic with an ! – this’ll now only keep columns where the number of entries per town is greater than 228. The comma before the square bracket says to include all columns (we could add filters there if we liked). We assign all of this to itself, in effect filtering the original data frame by removing any lines belonging to towns which don’t have a full complement of points. All in that one line.

In practical advice for the novice R coder (which I’d class myself as) – start with the smallest bit of code you can and then add bits on when you’re comfortable with what they’re doing. Actually, that’s not just true of R – the bash one-liner above would likely be best constructed in exactly the same way.

Anyway, where were we?

myData$Datey <- as.Date(paste(myData$Year, myData$Month, 1, sep='-'), '%Y-%m-%d')
myData <- myData[,!(names(myData) %in% c("Year", "Month"))]
ts_frame <- dcast(myData, Datey ~ Town, value.var="Average_Price")
row.names(ts_frame) <- ts_frame$Datey
ts_frame <- ts_frame[,!(names(ts_frame) %in% c("Datey"))]
growth_frame = data.frame(matrix(0, ncol=1, nrow=length(ncol(ts_frame))))
row.names(growth_frame) <- names(ts_frame)
for (i in 1:ncol(ts_frame)) {
  total_growth <- 100*((ts_frame[length(ts_frame[,i]),i] - ts_frame[1,i])/ts_frame[1,i])
  growth_frame[[names(ts_frame)[i]]] = total_growth
}
long_growth_frame <- melt(growth_frame)
colnames(long_growth_frame) <- c("Town", "Percentage_growth")
long_growth_frame <- long_growth_frame[long_growth_frame$Percentage_growth > 0.1,]
ggplot(long_growth_frame, aes(x=Percentage_growth)) + geom_density() + ggtitle("Percent Uplift in UK housing prices between 1995 and 2014")

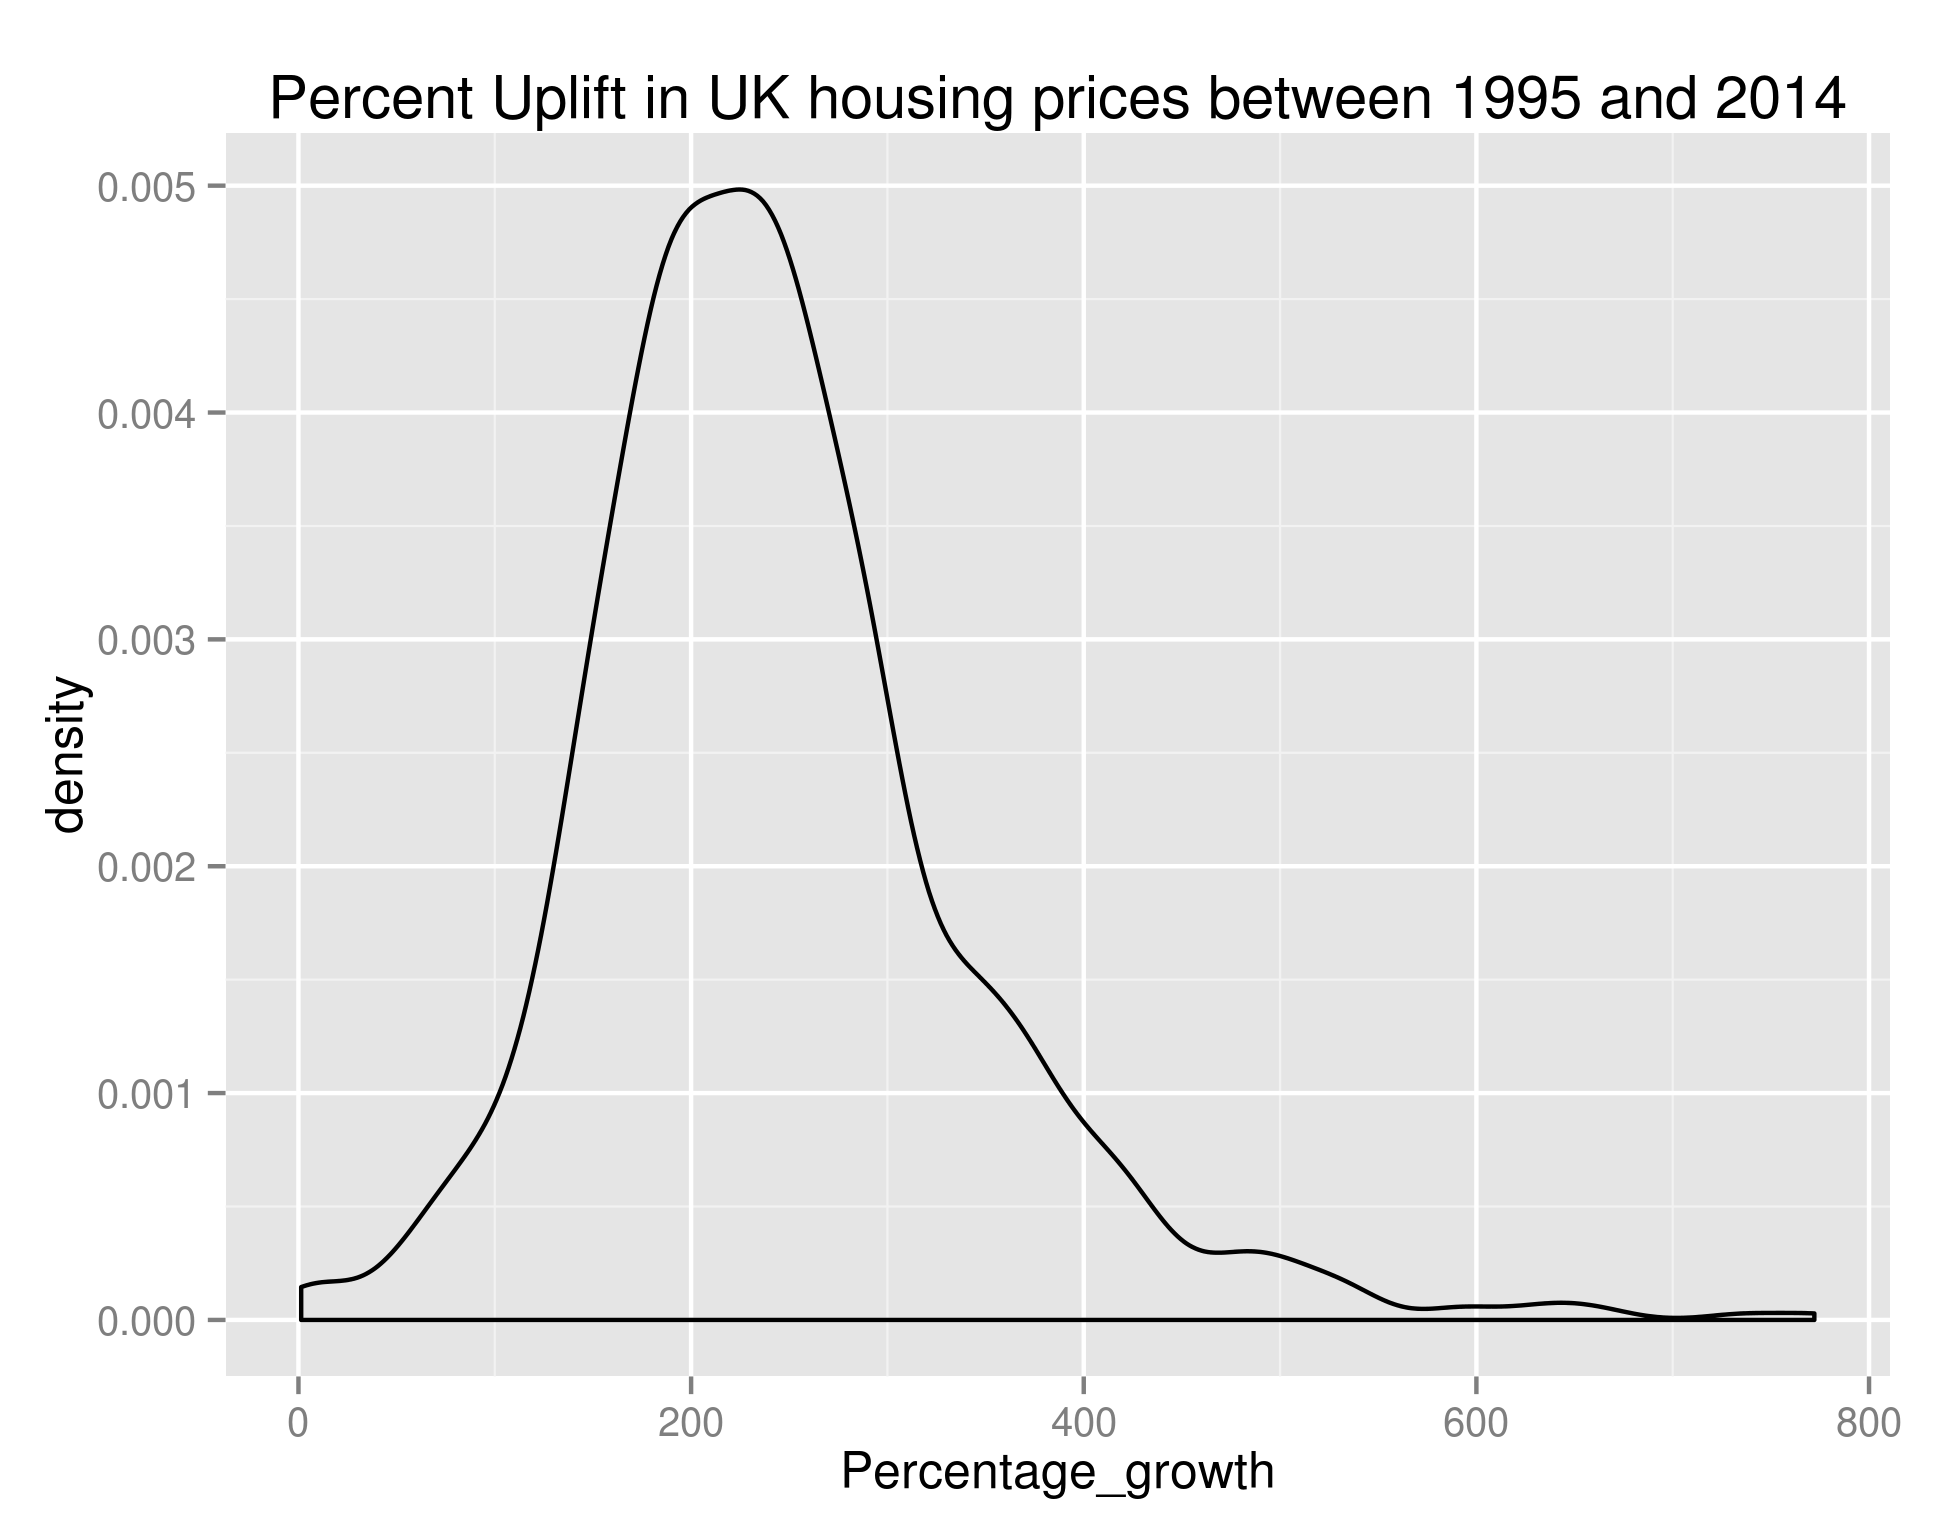
giving us:

Growth in UK House Prices

Density of the Percentage Growth of Average House Price (by town) in the UK between 1995 and 2014

As we can see, the bulk of towns experienced between 100% and 400% growth in that time – if anybody can point me towards UK salary figures over that time period I think that’d be a nice set to join this with.

Anyway, let’s take what we’ve done in the previous post on house prices and plot the data on a UK map. There are too many points for me to reasonably plot all of them – let’s go with the top 20 (Red diamonds) and bottom 20 (black crosses):

ordered_growth_frame <- long_growth_frame[order(long_growth_frame$Percentage_growth),]
library(maps)
library(mapdata)
library(RCurl)
library(RJSONIO)
## A couple of functions allowing us to dynamically get the longitude and latitude of regions
construct.geocode.url <- function(address, return.call = "json", sensor = "false") {
  root <- "http://maps.google.com/maps/api/geocode/"
  u <- paste(root, return.call, "?address=", address, "&sensor=", sensor, sep = "")
  return(URLencode(u))
}

gGeoCode <- function(address,verbose=FALSE) {
  if(verbose) cat(address,"n")
  u <- construct.geocode.url(address)
  doc <- getURL(u)
  x <- fromJSON(doc,simplify = FALSE)
  if(x$status=="OK") {
    lat <- x$results[[1]]$geometry$location$lat
    lng <- x$results[[1]]$geometry$location$lng
    return(c(lat, lng))
  } else {
    return(c(NA,NA))
  }
}

map('worldHires',  c('UK', 'Ireland', 'Isle of Man','Isle of Wight'), xlim=c(-7,2), ylim=c(50.1,58.7))  
long_and_lat <- data.frame(sapply(paste(head(ordered_growth_frame, n=20)$Town, ", UK", sep=''), function(x) gGeoCode(x)))
row.names(long_and_lat) <- c("Latitude", "Longitude")
long_and_lat <- data.frame(t(long_and_lat))
points(long_and_lat$Longitude, long_and_lat$Latitude, col=1, pch=4)
long_and_lat <- data.frame(sapply(paste(tail(ordered_growth_frame, n=20)$Town, ", UK", sep=''), function(x) gGeoCode(x)))
row.names(long_and_lat) <- c("Latitude", "Longitude")
long_and_lat <- data.frame(t(long_and_lat))
points(long_and_lat$Longitude, long_and_lat$Latitude, col=2, pch=5)
title('Fastest/Slowest Growing House Prices - UK (1995-2014)')
legend("topright", legend=c("Fastest", "Slowest"), title="Legend", bty="n", pch=c(5,4), col=c("red", "black"), inset=c(-0.05,0))

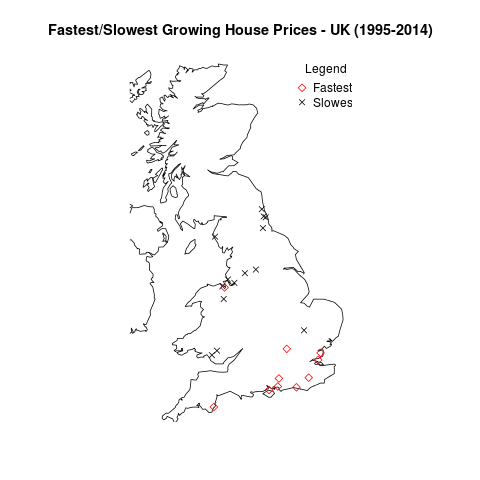
giving us:

UK Growth Map

The towns with the fastest and slowest growth in average house price since 1995.

So it looks like the South Coast has been the place to buy houses in the last 20 or so years. And the North East/North West were the places to be avoided.

OK – that’s all well and good but it doesn’t really tell us anything about the area we should be buying houses in now. Hold your horses. I’m getting to that. Obviously we’re not really going to be able to learn anything looking at the price difference between the end of our ‘test’ period and the start of our ‘test’ period. We need to build our model over a subset of this data, and test it against the remaining data.

For my next trick (blog post) I’ll look at predicting the fastest growing regions. As a sneak peek, to do we’ll use growth % as the metric we’re trying to predict (a continuous variable) and we’ll create features out of the input data set. I don’t know which method we’ll use yet but it’ll be one of linear regression, SVM regression or neural networks. Likely whichever is best supported by the language I choose to use. I’ve used Libsvm before and found it very good so maybe that.

What we do in life echoes in eternity.

Markov Clustering – What is it and why use it?

Hi all,

Bit of a different blog coming up – in a previous post I used Markov Clustering and said I’d write a follow-up post on what it was and why you might want to use it. Well, here I am. And here you are. So let’s begin:

In the simplest explanation, imagine an island. The island is connected to a whole bunch of other islands by bridges. The bridges are made out of bricks. Nothing nasty so far – apart from the leader of all the islands. They’re a ‘man versus superman’, ‘survival of the fittest’ sort and so one day the issue a proclamation. “Every day a brick will be taken from every bridge connected to your island and the bricks will be reapportioned on your island back to the bridges, in proportion to the remaining number of bricks in the bridge.”

At first, nobody is especially worried – each day, a brick disappears and then reappears on a different bridge on the island. Some of the islands notice some bridges getting three or four bricks back each day. Some hardly ever seem to see a brick added back to their bridge. Can you see where this will lead in 1000 years? In time, some of the bridges (the smallest ones to start off with) fall apart and end up with no bricks at all. If this is the only way between two islands, these islands become cut off entirely from each other.

This is basically Markov clustering.

For a more mathematical explanation:

Let’s start with a (transition) matrix:

import numpy as np
transition_matrix = np.matrix([[0,0.97,0.5],[0.2,0,0.5],[0.8,0.03,0]])

Transition Matrix = begin{matrix}  0 & 0.97 & 0.5 \  0.2 & 0 & 0.5 \  0.8 & 0.03 & 0  end{matrix}

In the above ‘islands’ picture those numbers represent the number of bricks in the bridges between islands A, B and C. In the random-walk interpretation, those are the probabilities that you’ll end up at each node as the number of random walks tends to infinity. In my previous post on house prices, I used a correlation matrix.

First things first – I’m going to stick a one in each of the identity areas. If you’re interested in why that is, have a read around self-loops and, even better, try this out both with and without self-loops. It sort of fits in nicely with the above islands picture but that’s more of a fluke than anything else – there’s always the strongest bridge possible between an island and itself. The land. Anyway…

np.fill_diagonal(transition_matrix, 1)

Transition Matrix = begin{matrix}  1 & 0.97 & 0.5 \  0.2 & 1 & 0.5 \  0.8 & 0.03 & 1  end{matrix}

Now let’s normalize – make sure each column sums to 1:

transition_matrix = transition_matrix/np.sum(transition_matrix, axis=0)

Transition Matrix = begin{matrix}  0.5 & 0.485 & 0.25 \  0.1 & 0.5 & 0.25 \  0.4 & 0.015 & 0.5  end{matrix}

Now we perform an expansion step – that is, we raise the matrix to a power (I’ll use two – you can change this parameter – in the ‘random-walk’ picture this can be thought of as varying how far a person can walk from their original island).

transition_matrix = np.linalg.matrix_power(transition_matrix, 2)

Expanded Matrix = begin{matrix}  0.3985 & 0.48875 & 0.37125 \  0.2 & 0.30225 & 0.275 \  0.4015 & 0.209 & 0.35375  end{matrix}

Then we perform the inflation step – This involves multiplying each element in the matrix by itself (to a power) and then normalizing on column again. Again, I’ll be using two as a power – increasing this leads to a greater number of smaller clusters:

for entry in np.nditer(transition_matrix, op_flags=['readwrite']):
    entry[...] = entry ** 2

Inflated Matrix = begin{matrix}  0.15880225 & 0.23887556 & 0.13782656 \  0.04 & 0.09135506 & 0.075625 \  0.16120225 & 0.043681 & 0.12513906  end{matrix}

Finally (for this iteration) – we’ll normalize by row.

transition_matrix = transition_matrix/np.sum(transition_matrix, axis=0)

Normalized Matrix = begin{matrix}  0.44111185 & 0.63885664 & 0.40705959 \  0.11110972 & 0.24432195 & 0.22335232 \  0.44777843 & 0.11682141 & 0.36958809  end{matrix}

And it’s basically that simple. Now all we need to do is rinse and repeat the expansion, inflation and normalization until we hit a stable(ish) solution i.e.

Normalized Matrix_{n+1} - Normalized Matrix_n < epsilon
for some small epsilon.

Once we’ve done this (with this particular matrix) we should see something like this:

Final Matrix = begin{matrix}  1 & 1 & 1 \  0 & 0 & 0 \  0 & 0 & 0  end{matrix}

Doesn’t look like a brilliant result be we only started with a tiny matrix. In this case we have all three nodes belonging to one cluster. The first node (the first row) is the ‘attractor’ – as it has values in its row it is attracting itself and the second and third row (the columns). If we were to end up with the following result (from a given initial matrix):

Final Matrix = begin{matrix}  1 & 0 & 1 & 0 & 0\  0 & 1 & 0 & 1 & 0\  0 & 0 & 0 & 0 & 0\  0 & 0 & 0 & 0 & 0\  0 & 0 & 0 & 0 & 1\  end{matrix}

This basically says that we have three clusters {1,3} (with 1 as the attractor), {2,4} (with 2 as the attractor) and {5} on its lonesome.

Instead of letting you piece all that together here’s the code for Markov Clustering in Python:

import numpy as np
import math
## How far you'd like your random-walkers to go (bigger number -> more walking)
EXPANSION_POWER = 2
## How tightly clustered you'd like your final picture to be (bigger number -> more clusters)
INFLATION_POWER = 2
## If you can manage 100 iterations then do so - otherwise, check you've hit a stable end-point.
ITERATION_COUNT = 100
def normalize(matrix):
    return matrix/np.sum(matrix, axis=0)

def expand(matrix, power)
    return np.linalg.matrix_power(matrix, power)

def inflate(matrix, power):
    for entry in np.nditer(transition_matrix, op_flags=['readwrite']):
        entry[...] = math.pow(entry, power)
    return matrix

def run(matrix):
    np.fill_diagonal(matrix, 1)
    matrix = normalize(matrix)
    for _ in range(ITERATION_COUNT):
        matrix = normalize(inflate(expand(matrix, EXPANSION_POWER), INFLATION_POWER))
    return matrix

If you were in the mood to improve it you could write something that’d check for convergence for you and terminate once you’d achieved a stable solution. You could also write a function to perform the cluster interpretation for you.

As you were.

Stock Prices and Python – Pandas to the rescue

Hi all,

Today I fancy a bit of a play around with stock prices – I recently took the plunge into the world of stocks & shares and have been getting more and more interested in the financial world as I’ve become more and more exposed to it through savings. I’m a bit sceptical as to being able to find anything ‘new’ or any real arbitrage opportunities – mostly because there’s a billion (trillion?) dollar industry built off of the back of stock trading. It attracts some really smart people with some really powerful gear and a whole lot of money to invest. However, there’s no harm in having a look around and seeing what interesting things we can do with the data.

R is well good but I want a bit more freedom with this little project and I’m missing Python. I find that with R, I spend a lot of my time getting data into the right format to be able to use the tools that already exist. With Python, if I’m silly enough to decide on a strange data structure then I can. I shouldn’t, but I can.

Ordinarily I like the Python & SQL combination and tend not to rely too heavily on the ‘Python analysis stack’ of Pandas/iPython/Scipy/Matplotlib, only pulling things in when necessary. I was going to follow the same pure Python & SQL route for this project until I found an awesome little feature of Pandas – in-built Google and Yahoo stock data integration. It’s not that much work to build this sort of thing yourself but why reinvent the wheel? 🙂

So – I guess we should start with some sort of question, shall we see if we can plot some of the big tech players (AMZ, GOOGL, FB e.t.c.) against the whole tech sector. Given the recent headlines in that area it should be interesting and at least give us some ideas about future work.

As a lazy person, I’m not necessarily inclined to manually go through a list of stock symbols and decide if they’re tech or even go through a list of tech stock and type them into a text file. A quick google shows me that there’s nothing (that I could find) in the way of a regularly updated text file of what I’m after but it shouldn’t be too difficult to coax Python into doing this for me – let’s start off with the NASDAQ site.

If you have a look, you’ll see it’s fairly regular in its URL structure and the URLs are easily craftable – there’s an annoying amount of pagination but you can’t have everything. Actually, hold the phone. You can download the list as a CSV – winner winner chicken dinner.

Downloading all the company information we get a CSV with the following headers:

Symbol Name LastSale MarketCap ADR TSO IPOyear Sector Industry Summary Quote

All I’m really after for now is the sector and symbol – market cap will prove useful but basically I think I can agree we’ve hit the jackpot!

Time for the Python:

from pandas.io.data import DataReader
import pandas as pd
from datetime import datetime
import numpy as np
company_information = pd.read_csv('allcompany.csv')
mega_frame = [DataReader(company.strip(),  "yahoo", datetime(2014,1,1), datetime.now().date()) for company in company_information[company_information.Sector == 'Technology']['Symbol']]
symbol_list = [symbol for symbol in company_information[company_information.Sector == 'Technology']['Symbol']]

At this point we’ve got all the data since the start of the year on every tech stock listed on the NASDAQ, NYSE and AMEX and it’s taken us 6 lines. Note that the population of mega_frame takes a fairly long time. In retrospect, we should have filtered further

20 minutes later and I’m regretting my decision to get all of them.

Cancelled it and switched to the first 50 – will just prove concept first.

Right, now I’ve got a list containing data frames – one for each of the first 50 tech stocks. Let’s throw in a percentage change column and make sure all our data frames are of the same length to avoid problems at a later date:

mega_frame = [stock for stock in mega_frame if len(stock) == 79]
symbol_list = [symbol_list[index] for index in len(symbol_list) if len(mega_frame[i]) == 79]
for stock_index in range(len(mega_frame)):
    mega_frame[stock_index]['perc_change'] = 100*((mega_frame[stock_index]['Close'] - mega_frame[stock_index]['Open'])/mega_frame[stock_index]['Open'])
## The modal value is 79 hence 79
percentage_change_list = [stock['perc_change'] for stock in mega_frame]

Now we’re going to create a correlation matrix out of those lists to see the most strongly correlated tech stocks over that time period (and in our subset). I’m also going to look at the negatively correlated stocks – you wouldn’t expect to see a strong negative correlation for two stocks in the same sector and region but it won’t hurt to look:

correlation_matrix = np.corrcoef(percentage_change_list)
## Correlation with yourself is no big deal
for i in range(np.shape(correlation_matrix)[0]):
    for j in range(np.shape(correlation_matrix)[1]):
        if i == j:
             correlation_matrix[i][j] = 0
maximum_indices = np.argmax(correlation_matrix, axis=1)
minimum_indices = np.argmin(correlation_matrix, axis=1)
for index in range(np.shape(correlation_matrix)[0]):
    print "Stock %s is best correlated with stock %s: %.3g" % (my_list[index], my_list[maximum_indices[index]], correlation_matrix[index][maximum_indices[index]])
    print "Stock %s is worst correlated with stock %s: %.3g" % (my_list[index], my_list[minimum_indices[index]], correlation_matrix[index][minimum_indices[index]])

So there we have it (I’ll leave it to run over all the tech stocks overnight) – a fairly quick and simple way to find the most correlated tech stocks in America over a given time period.

Now this isn’t a particularly great way of doing this, as I said earlier, there are people who dedicate their lives to this. If the fancy takes me, I’ll have a look at a few of these (maximal spanning trees, stability of eigenvectors of correlation matrices e.t.c) and see what improvements we can make to our very simple model.

Installing Hadoop 2.4 on Ubuntu 14.04

Hey all,

Another of my ‘getting my new operating system set up with all the bits of kit I use’ – this time we’ll be on Hadoop (and HDFS). There’s a very strong chance that this post will end up a lot like Sean’s post – Hadoop from spare-change. If there are any differences it’ll be for these reasons three:
1.) He was using Ubuntu Server 13.04 not Ubuntu Desktop 14.04
2.) He was using Hadoop 2.2 not Hadoop 2.4
3.) He was setting up a whole bunch of nodes – I’m stuck with this oft-abused laptop

Anywho – on with the show.

Step 1:

Download Hadoop from Apache: I’ll be using this mirror but I trust that if you’re not in England, you can likely find a more suitable one:
http://mirror.ox.ac.uk/sites/rsync.apache.org/hadoop/common/hadoop-2.4.0/hadoop-2.4.0.tar.gz

If you’re trying to stick to the terminal/don’t have a GUI then go with this:

wget http://mirror.ox.ac.uk/sites/rsync.apache.org/hadoop/common/hadoop-2.4.0/hadoop-2.4.0.tar.gz

Find your way to wherever you downloaded the tar.gz file and untar it using the following command:

tar -xzf hadoop-2.4.0.tar.gz

Sorry if I’m teaching you to suck eggs – everybody has to start somewhere right?

Has it worked up till here?

Run the following command in the same directory you ran the above tar command:

ls | grep hadoop | grep -v *.gz

If there’s at least one line returned (ideally hadoop-2.4.0) then you’re good up till here.

Step 2:

Let’s move everything into a more appropriate directory:

sudo mv hadoop-2.4.0/ /usr/local
cd /usr/local
sudo ln -s hadoop-2.4.0/ hadoop

We create that link to allow us to write scripts/programs that interact with Hadoop that won’t need changing if we upgrade our Hadoop version. All we’ll do is install the new version and point the Hadoop folder to the new version instead. Ace.

Has it worked up to here?

Run this command anywhere:

whereis hadoop

If the output is:
hadoop: /usr/local/hadoop
you may proceed.

Step 3:

Righty, now we’ll be setting up a new user and permissions and all that guff. I’ll steal directly from Michael Noll’s tutorial here and go with:

sudo addgroup hadoop
sudo adduser --ingroup hadoop hduser
sudo adduser hduser sudo
sudo chown -R hduser:hadoop /usr/local/hadoop/

Has it worked up to here?

Type:

ls -l /home/ | grep hadoop

If you see a line then you’re in the money.

Step 4:

SSH is a biggy – possibly not so much for the single node tutorial but when we were setting up our first cluster, SSH problems probably accounted for about 90% of all head-scratching with the remaining 10% being nits.


su - hduser
sudo apt-get install ssh
ssh-keygen -t rsa -P ""
cat ~/.ssh/id_rsa.pub >> ~/.ssh/authorized_keys

So we switch to our newly created user, generate an SSH key and get it added to our authorized keys. Unfortunately, Hadoop and ipv6 don’t play nice so we’ll have to disable it – to do this you’ll need to open up /etc/sysctl.conf and add the following lines to the end:


net.ipv6.conf.all.disable_ipv6 = 1
net.ipv6.conf.default.disable_ipv6 = 1
net.ipv6.conf.lo.disable_ipv6 = 1

Fair warning – you’ll need sudo privileges to modify the file so might want to open up your file editor like this:

sudo apt-get install gksu
gksu gedit /etc/sysctl.conf

If you’re set on using terminal then this’ll do it:

echo "net.ipv6.conf.all.disable_ipv6 = 1" | sudo tee -a /etc/sysctl.conf
echo "net.ipv6.conf.default.disable_ipv6 = 1" | sudo tee -a /etc/sysctl.conf
echo "net.ipv6.conf.lo.disable_ipv6 = 1" | sudo tee -a /etc/sysctl.conf

Rumour has it that at this point you can run
sudo service networking restart
and kapeesh – ipv6 is gone. However, Atheros and Ubuntu seem to have a strange sort of ‘not working’ thing going on and so that command doesn’t work with my wireless driver. If the restart fails, just restart the computer and you should be good.

(if you’re terminal only : sudo shutdown -r now )

Has it worked up to here?

If you’re stout of heart, attempt the following:

su - hduser
ssh localhost

If that’s worked you be greeted with a message along the lines of ‘Are you sure you want to continue connecting?’ The answer you’re looking for at this point is ‘yes’.

If it hasn’t worked at this point run the following command:
cat /proc/sys/net/ipv6/conf/all/disable_ipv6

If the value returned is 0 then you’ve still not got ipv6 disabled – have a re-read of that section and see if you’ve missed anything.

Step 5:
I’m going to assume a clean install of Ubuntu on your machine (because that’s what I’ve got) – if this isn’t the case, it’s entirely likely you’ll already have Java installed. If so, find your JAVA_HOME (lots of tutorials on this online) and use that for the upcoming instructions. I’m going to be installing Java from scratch:

sudo apt-get update
sudo apt-get install default-jdk

Given a bit of luck, you’ll now have Java on your computer (I do on mine) and you’ll be able to set your environment variables. Open up your bashrc file:

su - hduser
gksu gedit .bashrc

and add the following lines:

export HADOOP_HOME=/usr/local/hadoop
export JAVA_HOME=/usr

and follow up with this command:
source ~/.bashrc

If you’ve deviated from any of the instructions above, those lines are likely to be different. You can find what your java home should be by running the following command:
which java | sed -e 's/(.*)/bin/java/1/g'

Your Hadoop home will be wherever you put it in step 2.

Has it worked up to here?

So many different ways to test – let’s run our first Hadoop command:

/usr/local/hadoop/bin/hadoop version

If that worked with no error (and gave you your Hadoop version) then you’re laughing.

Step 6:

Configuration of Hadoop (and associated bits and bobs) – we’re going to be editing a bunch of files so pick your favourite file editor and get to work. First things first though, you’re going to want some place for HDFS to save your files. If you’ve going to be storing anything big/bought external storage for this purpose now is the time to deviate from this tutorial. Otherwise, this should do it:


su - hduser
mkdir /usr/local/hadoop/data

Now for the file editing:

(only necessary when running a multi-node cluster, but let’s do it in case we ever get more nodes to add)
1.) /usr/local/hadoop/etc/hadoop/hadoop-env.sh
Change export JAVA_HOME=${JAVA_HOME} to match the JAVA_HOME you set in your bashrc (for us JAVA_HOME=/usr).
Also, change this line:
export HADOOP_OPTS="$HADOOP_OPTS -Djava.net.preferIPv4Stack=true
to be

export HADOOP_OPTS="$HADOOP_OPTS -Djava.net.preferIPv4Stack=true -Djava.library.path=$HADOOP_PREFIX/lib"

And finally, add the following line:
export HADOOP_COMMON_LIB_NATIVE_DIR=${HADOOP_PREFIX}/lib/native

2.) /usr/local/hadoop/etc/hadoop/yarn-env.sh
Add the following lines:

export HADOOP_CONF_LIB_NATIVE_DIR=${HADOOP_PREFIX:-"/lib/native"}
export HADOOP_OPTS="-Djava.library.path=$HADOOP_PREFIX/lib"

3.) /usr/local/hadoop/etc/hadoop/core-site.xml
Change the whole file so it looks like this:

<?xml version="1.0" encoding="UTF-8"?>
<?xml-stylesheet type="text/xsl" href="configuration.xsl"?>
<configuration>
<property>
  <name>fs.default.name</name>
  <value>hdfs://localhost:9000</value>
</property>
<property>
  <name>hadoop.tmp.dir</name>
  <value>/usr/local/hadoop/data</value>
</property>
</configuration>

4.) /usr/local/hadoop/etc/hadoop/mapred-site.xml
Change the whole file so it looks like this:

<?xml version="1.0"?>
<?xml-stylesheet type="text/xsl" href="configuration.xsl"?>

<configuration>
    <property>
        <name>mapreduce.framework.name</name>
        <value>yarn</value>
    </property>
</configuration>

5.) /usr/local/hadoop/etc/hadoop/hdfs-site.xml
Change the whole file so it looks like this:

<?xml version="1.0" encoding="UTF-8"?>
<?xml-stylesheet type="text/xsl" href="configuration.xsl"?>

<configuration>
    <property>
        <name>dfs.replication</name>
        <value>3</value>
    </property>
</configuration>

6.) /usr/local/hadoop/etc/hadoop/yarn-site.xml
Change the whole file so it looks like this:

<?xml version="1.0"?>
<configuration>
    <property>
        <name>yarn.nodemanager.aux-services</name>
        <value>mapreduce_shuffle</value>
    </property>
    <property>
        <name>yarn.nodemanager.aux-services.mapreduce_shuffle.class</name>
        <value>org.apache.hadoop.mapred.ShuffleHandler</value>
    </property>
    <property>
        <name>yarn.resourcemanager.resource-tracker.address</name>
        <value>localhost:8025</value>
    </property>
    <property>
        <name>yarn.resourcemanager.scheduler.address</name>
        <value>localhost:8030</value>
    </property>
    <property>
        <name>yarn.resourcemanager.address</name>
        <value>localhost:8050</value>
    </property>
</configuration>

Annnd we’re done 🙂 Sorry about that – if I could guarantee that you’d be using the same file paths and OS as me then I’d let you wget those files from a Github somewhere but alas, I think that’s likely to cause more headaches than it solves. Don’t worry, we’re nearly there now 🙂

Has it worked up to here?

Run the following command:

/usr/local/hadoop/bin/hadoop namenode -format

If that works, you’re 20% of the way there.

Then, run:

/usr/local/hadoop/sbin/start-dfs.sh

If that seems to work without throwing up a bunch of errors:

/usr/local/hadoop/sbin/start-yarn.sh

If that’s worked, you can safely say you’ve got Hadoop running on your computer 🙂 Get it on the LinkedIn as a strength as soon as possible 😉

Conclusion
Now you’ve got Hadoop up and running on your computer, what can you do? Well, unfortunately with that single node and single hard disk, not much you couldn’t have done without it. However, if you’re just getting started with Linux and Hadoop you’ll have hopefully learnt a bit on the way to setting up your cluster.

« Older posts Newer posts »

© 2025 DogDogFish

Theme by Anders NorenUp ↑